Aimathic
Login | English | Deutsch

Free math worksheets

Build your own math worksheets from 30,000+ problems for grades 3 to 12, from fractions to AP Calculus. Every problem comes with step-by-step solutions.

Draw scaled bar graphs

Click problems to add them to your worksheet.

5381133
Birds were counted at a feeder in the morning. Each tick mark on the bar graph represents \(2\) birds. Which kind of bird was seen most often, and how many were seen?
Figure for problem 538113

Hints

- Use the scale along the horizontal axis. - Compare the lengths of the bars.

Solution

1. Use the scale to read the four bars. 2. The longest bar is the chickadee bar, which shows \(8\) birds.

Answer

Chickadees were seen most often: \(8\) birds.
5381143
The bar graph shows how many books were checked out from the school library each day. Each tick mark represents \(2\) books. On which day were the fewest books checked out?
Figure for problem 538114

Hints

- Use the scale on the vertical axis. - Compare the heights of the bars.

Solution

1. Use the scale to read the bars. 2. The shortest bar is the Tuesday bar, which shows \(4\) books.

Answer

The fewest books were checked out on Tuesday: \(4\) books.
5382173
Paper used by four Grade 3 classes: <table><tr><th>Class</th><th>Sheets of paper</th></tr><tr><td>3A</td><td>\(45\)</td></tr><tr><td>3B</td><td>\(35\)</td></tr><tr><td>3C</td><td>\(50\)</td></tr><tr><td>3D</td><td>\(40\)</td></tr></table> Give an appropriate label for the horizontal axis and the vertical axis of a bar graph. Then list the bar heights.

Hints

- Break the task into axis labels and bar heights. - Check that each axis label describes the information shown on that axis.

Solution

1. The categories are the four classes, so label the horizontal axis “Class.” 2. The values count sheets of paper, so label the vertical axis “Sheets of paper.” 3. In table order, the bar heights are \(45, 35, 50, 40\).

Answer

Horizontal axis: Class. Vertical axis: Sheets of paper. Bar heights: \(45, 35, 50, 40\).
5382233
Rainfall on four days: <table><tr><th>Day</th><th>Rainfall in mm</th></tr><tr><td>Monday</td><td>\(4\)</td></tr><tr><td>Tuesday</td><td>\(0\)</td></tr><tr><td>Wednesday</td><td>\(7\)</td></tr><tr><td>Thursday</td><td>\(3\)</td></tr></table> How is the value \(0\) shown in a bar graph? Also give the other bar heights.

Hints

- Break the task into the zero value and the positive values. - Check that every bar height matches the value in the table.

Solution

1. Match each day to its rainfall value. 2. Tuesday’s bar has height \(0\,\text{mm}\), so no bar rises above the axis, but the Tuesday category label remains. 3. The other bar heights are \(4\,\text{mm}\), \(7\,\text{mm}\), and \(3\,\text{mm}\).

Answer

Tuesday has a bar height of \(0\,\text{mm}\), with its category label still shown. The other heights are \(4\,\text{mm}\), \(7\,\text{mm}\), and \(3\,\text{mm}\).
5382733
A class records how many minutes four students read. <table><tr><th>Student</th><th>Minutes</th></tr><tr><td>Ava</td><td>\(18\)</td></tr><tr><td>Bo</td><td>\(25\)</td></tr><tr><td>Cem</td><td>\(14\)</td></tr><tr><td>Dana</td><td>\(21\)</td></tr></table> Which complete set of labels can be used without changes? A) x-axis: “Reading time in minutes”; y-axis: “Students”; title: “Unrelated Title” B) x-axis: “Students”; y-axis: “Reading time in minutes”; title: “Reading Time of Four Students” C) x-axis: “Colors”; y-axis: “Weight”; title: “Random Data”

Hints

- Check the title and both axis labels. - Match the categories and measured quantity with the correct axes.

Solution

1. The categories are the students, so “Students” belongs on the x-axis. 2. The measured quantity is reading time, so “Reading time in minutes” belongs on the y-axis. 3. The title “Reading Time of Four Students” accurately describes the graph. Therefore, choice B is correct.

Answer

Choice B is correct.
5382793
A bar graph shows the points earned by the Red, Blue, Green, and Yellow teams. Which title fits best: “Our School,” “Field Day Points,” or “Four Colors”? Briefly explain.

Hints

- Compare each title with the information represented by the graph. - Choose the title that is specific rather than vague.

Solution

1. A useful title should identify both the data and the event. 2. “Field Day Points” describes exactly what the graph shows.

Answer

“Field Day Points” fits best because it names the event and the quantity shown.
5382833
A graph shows frogs observed at four ponds. Its title is “Animals,” and its vertical axis is labeled “Things.” Improve both labels so the graph is immediately clear.

Hints

- Make each label specific to the data. - Check that a reader can tell both what is counted and where the counts come from.

Solution

1. The title should name the animal and the locations being compared. 2. The vertical axis should name the quantity being counted.

Answer

For example, title: “Frogs at Four Ponds”; vertical axis: “Number of frogs.”
5316943
A Grade 3 class surveyed students about their favorite animals. The graph shows the results. Use the graph to answer the questions. a) Which animal is the most popular? b) How many students voted for either a dog or a cat? c) How many students participated in the survey?
Figure for problem 531694

Hints

- Read each bar length using the horizontal scale. - Add the two requested categories for part b). - Add all five categories for the total number of participants.

Solution

1. The longest bar is Cat, with \(11\) votes, so Cat is the most popular. 2. Add the Dog and Cat votes: \(8 + 11 = 19\) students. 3. Add all five categories: \(8 + 11 + 4 + 6 + 3 = 32\) students.

Answer

a) Cat b) \(19\) students c) \(32\) students
5317043
The bar graph shows the monthly rainfall in a city from March through June. Use the graph to answer the questions. a) Which month had the most rainfall? b) How much rain fell during the four months altogether?
Figure for problem 531704

Hints

- Read each bar height using the vertical axis. - Identify the month with the tallest bar. - Add all four monthly values to find the total.

Solution

1. Read the bar values: March, \(50\,\text{mm}\); April, \(65\,\text{mm}\); May, \(80\,\text{mm}\); June, \(45\,\text{mm}\). 2. The greatest value is \(80\,\text{mm}\), in May. 3. Add the four values: \(50 + 65 + 80 + 45 = 240\,\text{mm}\).

Answer

a) May b) \(240\,\text{mm}\)
5317303
Five students took part in a throwing event at an elementary school field day. The horizontal bar graph shows each student’s best throw. Use the graph to answer the questions. a) Who threw the farthest, and how far was the throw? b) What is the difference between the farthest and shortest throws?
Figure for problem 531730

Hints

- Use the horizontal-axis scale to read each bar length. - Find the longest bar for part a). - Find the shortest bar before subtracting. - Subtract the smaller distance from the larger distance.

Solution

1. Read the values from the graph: Lena, \(12\,\text{ft}\); Felix, \(28\,\text{ft}\); Jonah, \(32\,\text{ft}\); Maria, \(16\,\text{ft}\); Toby, \(24\,\text{ft}\). 2. Jonah has the farthest throw, \(32\,\text{ft}\). 3. Lena has the shortest throw, \(12\,\text{ft}\). 4. Find the difference: \(32 - 12 = 20\,\text{ft}\).

Answer

a) Jonah, \(32\,\text{ft}\) b) \(20\,\text{ft}\)
5317353
During summer break, students in a class recorded how many books they read. The bar graph shows the results. a) How many students read more than \(2\) books? b) How many students read fewer than \(2\) books?
Figure for problem 531735

Hints

- Read the count represented by each bar. - Decide whether the category of exactly \(2\) books belongs in “more than \(2\).” - Identify the categories included in “fewer than \(2\).” - Add the counts for the relevant categories.

Solution

1. “More than \(2\)” includes the categories \(3\), \(4\), and \(5+\) books. Add their counts: \(10 + 5 + 2 = 17\) students. 2. “Fewer than \(2\)” includes the categories \(0\) and \(1\) book. Add their counts: \(3 + 8 = 11\) students.

Answer

a) \(17\) students b) \(11\) students
5317393
A video game gives six animal characters the speed ratings shown in the horizontal bar graph. a) Read and list the speed rating of each character. b) Which character has the second-highest speed rating, and what is that rating? c) Find the difference between the greatest and least speed ratings.
Figure for problem 531739

Hints

- Use the horizontal scale to read each bar endpoint. - The second-highest rating belongs to the second-longest bar. - Identify the greatest and least values before subtracting.

Solution

1. Read the ratings: Hare, \(35\); Greyhound, \(45\); Ostrich, \(40\); Lion, \(50\); Pronghorn, \(55\); Cheetah, \(70\). 2. Cheetah has the greatest rating, \(70\), and Pronghorn has the second-highest rating, \(55\). 3. Hare has the least rating, \(35\). The difference is \(70 - 35 = 35\) rating points.

Answer

a) Hare: \(35\); Greyhound: \(45\); Ostrich: \(40\); Lion: \(50\); Pronghorn: \(55\); Cheetah: \(70\) b) Pronghorn, \(55\) c) \(35\) rating points
5317473
The graph shows the number of sunshine hours on each day of one week during summer break. Use the graph to answer the questions. a) Which day had the most sunshine hours? b) How many sunshine hours were there from Monday through Friday altogether? c) What is the difference between the sunniest day and the day with the fewest sunshine hours?
Figure for problem 531747

Hints

- Compare every bar with the vertical scale. - Find the tallest bar for part a). - Add only Monday through Friday for part b). - For part c), subtract the least daily value from the greatest daily value.

Solution

1. Read the daily values: Monday, \(4\); Tuesday, \(6\); Wednesday, \(3\); Thursday, \(8\); Friday, \(5\); Saturday, \(10\); Sunday, \(7\) hours. 2. The greatest value is \(10\) hours on Saturday. 3. Add Monday through Friday: \(4 + 6 + 3 + 8 + 5 = 26\) hours. 4. The least value is \(3\) hours on Wednesday. The difference is \(10 - 3 = 7\) hours.

Answer

a) Saturday b) \(26\) hours c) \(7\) hours
5317613
A weather simulation produced the May rainfall totals shown for five fictional towns. a) Which town received the most rain, and which received the least? Give both amounts. b) How many more millimeters of rain fell in Lakeside than in Red Rock? c) Which three towns received less than \(70\,\text{mm}\) of rain?
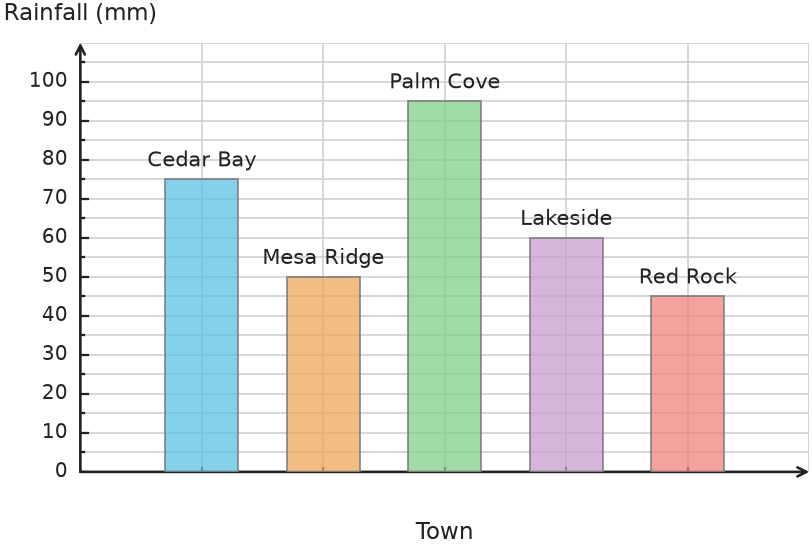
Figure for problem 531761

Hints

- Read each bar endpoint using the vertical scale. - Compare the five values to find the greatest and least. - Subtract the Red Rock value from the Lakeside value. - Check each town against \(70\,\text{mm}\).

Solution

1. Read the values: Cedar Bay, \(75\,\text{mm}\); Mesa Ridge, \(50\,\text{mm}\); Palm Cove, \(95\,\text{mm}\); Lakeside, \(60\,\text{mm}\); Red Rock, \(45\,\text{mm}\). 2. Palm Cove has the greatest value, \(95\,\text{mm}\), and Red Rock has the least, \(45\,\text{mm}\). 3. The difference between Lakeside and Red Rock is \(60 - 45 = 15\,\text{mm}\). 4. The towns below \(70\,\text{mm}\) are Mesa Ridge, Lakeside, and Red Rock.

Answer

a) Most: Palm Cove, \(95\,\text{mm}\); least: Red Rock, \(45\,\text{mm}\) b) \(15\,\text{mm}\) c) Mesa Ridge, Lakeside, and Red Rock

5317633
A design project includes four fictional landmarks. The horizontal bar graph shows their planned heights. a) Which landmark is tallest, and about how tall is it according to the graph? b) About how many feet shorter is Sky Needle than River Arch?
Figure for problem 531763

Hints

- Examine the horizontal scale before reading the bars. - Find the longest bar for part a). - Read the two requested heights and subtract the smaller from the larger.

Solution

1. Read the approximate heights: Bay Lantern, \(300\,\text{ft}\); Cedar Column, \(550\,\text{ft}\); Sky Needle, \(600\,\text{ft}\); River Arch, \(650\,\text{ft}\). 2. River Arch is tallest at about \(650\,\text{ft}\). 3. The difference between River Arch and Sky Needle is \(650 - 600 = 50\,\text{ft}\).

Answer

a) River Arch, about \(650\,\text{ft}\) b) About \(50\,\text{ft}\)
5317743
A Grade 3 class held a reading challenge. The bar graph shows how many pages five students read in one week. Use the graph to answer the questions. a) Who read the most pages, and how many pages did that student read? b) How many pages did the five students read altogether? c) How many more pages did Emma read than Noah?
Figure for problem 531774

Hints

- Read each bar height using the vertical axis. - Add all five values for the total. - Subtract Noah’s value from Emma’s value to find how many more pages she read.

Solution

1. The tallest bar belongs to Emma, with \(140\) pages. 2. Add all five values: \(80 + 120 + 60 + 140 + 100 = 500\) pages. 3. Find the difference between Emma and Noah: \(140 - 60 = 80\) pages.

Answer

a) Emma, \(140\) pages b) \(500\) pages c) \(80\) pages
5318233
A class surveyed students about their favorite pets. Each student chose one pet. The bar graph shows the results. Decide whether each statement is **true** or **false**. Use values from the graph to explain your answer. a) Dogs and birds received exactly \(10\) votes altogether. b) Cats and rabbits received exactly \(9\) votes altogether. c) A total of \(25\) students took the survey.
Figure for problem 531823

Hints

- Read the exact value of each bar. - Check each statement separately using the values you recorded. - Add the requested categories when a statement gives a combined total.

Solution

1. Read the values: dogs, \(8\); cats, \(6\); rabbits, \(3\); birds, \(2\); hamsters, \(4\). 2. For a), \(8 + 2 = 10\), so the statement is true. 3. For b), \(6 + 3 = 9\), so the statement is true. 4. For c), \(8 + 6 + 3 + 2 + 4 = 23\), so the statement is false.

Answer

a) **True**, because \(8 + 2 = 10\). b) **True**, because \(6 + 3 = 9\). c) **False**, because there were \(23\) votes altogether.
5318393
A school library recorded how many books students checked out each weekday. The bar graph shows the results. a) On which day were the most books checked out? How many books were checked out? b) How many books were checked out from Monday through Wednesday altogether?
Figure for problem 531839

Hints

- Compare the lengths of the bars with the scale. - Find the bar that extends farthest to the right. - Add the values for Monday, Tuesday, and Wednesday.

Solution

1. Read the values: Monday, \(12\); Tuesday, \(18\); Wednesday, \(15\); Thursday, \(22\); Friday, \(10\). 2. Thursday has the greatest value, \(22\) books. 3. Add the first three days: \(12 + 18 + 15 = 45\) books.

Answer

a) Thursday, \(22\) books b) \(45\) books
5318423
Students chose their favorite free-time activity. Each student chose one activity. The bar graph shows the results. a) How many students took the survey altogether? b) What is the difference between the number who chose sports and the number who chose music? c) Tim says, “Four more students chose sports than reading.” Is Tim correct? Explain using values from the graph.
Figure for problem 531842

Hints

- Add all four bar values for part a). - Subtract the smaller requested value from the larger one for part b). - For part c), compare the sports and reading bars directly.

Solution

1. Add all four values: \(12 + 8 + 10 + 6 = 36\) students. 2. The difference between sports and music is \(12 - 6 = 6\) students. 3. Compare sports and reading: \(12 - 8 = 4\), so Tim is correct.

Answer

a) \(36\) students b) \(6\) students c) Yes. Sports received \(12\) votes and reading received \(8\), a difference of \(4\).
5318433
A class collected recyclable bottles for four weeks. The bar graph shows how many bottles the class collected each week. a) During which week did the class collect the most bottles? How many did they collect? b) How many bottles did the class collect during all four weeks altogether?
Figure for problem 531843

Hints

- Read each bar using the scale on the vertical axis. - Find the tallest bar for part a). - Add all four weekly values for part b).

Solution

1. The tallest bar is Week 4, with \(50\) bottles. 2. Add the four weekly values: \(30 + 45 + 25 + 50 = 150\) bottles.

Answer

a) Week 4, \(50\) bottles b) \(150\) bottles
5318493
A community pool recorded the number of visitors each weekday during a warm summer week. The bar graph shows the results. a) On which day did the pool have the most visitors? How many visitors were there? b) How many visitors came during the first three days, from Monday through Wednesday, altogether?
Figure for problem 531849

Hints

- Use the vertical-axis scale to read each bar. - Find the tallest bar for part a). - Add the values for Monday, Tuesday, and Wednesday for part b).

Solution

1. Read the values: Monday, \(250\); Tuesday, \(300\); Wednesday, \(150\); Thursday, \(400\); Friday, \(450\). 2. Friday has the greatest value, \(450\) visitors. 3. Add the first three days: \(250 + 300 + 150 = 700\) visitors.

Answer

a) Friday, \(450\) visitors b) \(700\) visitors
5318503
A class surveyed students about their favorite pets. Each student chose one pet. The bar graph shows the results. a) Which pet was chosen most often? How many students chose it? b) How many students took the survey altogether? c) What is the difference between the number of votes for cats and the number of votes for birds?
Figure for problem 531850

Hints

- Read the height of each bar. - Find the tallest bar for part a). - Add every bar value for part b). - Subtract the smaller value from the larger value to find the difference.

Solution

1. Read the values: dogs, \(8\); cats, \(10\); rabbits, \(5\); birds, \(3\); fish, \(2\). 2. Cats have the greatest value, \(10\). 3. Add all the votes: \(8 + 10 + 5 + 3 + 2 = 28\). 4. Subtract the bird votes from the cat votes: \(10 - 3 = 7\).

Answer

a) Cats, \(10\) students b) \(28\) students c) \(7\) students
5318543
A school held a reading challenge. The bar graph shows how many books four students read last month. a) Which student read the most books? How many books did that student read? b) How many more books did Anna and David read together than Ben read?
Figure for problem 531854

Hints

- Read each bar using the vertical-axis scale. - Find the tallest bar for part a). - For part b), first add Anna’s and David’s values, and then subtract Ben’s value.

Solution

1. Read the values: Anna, \(8\); Ben, \(5\); Clara, \(11\); David, \(4\) books. 2. Clara has the greatest value, \(11\) books. 3. Anna and David read \(8 + 4 = 12\) books together. Compare their total with Ben’s value: \(12 - 5 = 7\) books.

Answer

a) Clara, \(11\) books b) \(7\) more books
5318583
Students earned points for books they read during a school reading challenge. The bar graph shows the points earned by Anna, Ben, Clara, and David. a) Who earned the most points? b) How many points did Anna and Clara earn altogether? c) How many more points did David earn than Clara?
Figure for problem 531858

Hints

- Read each bar using the scale, which increases by \(5\). - Add the two values for part b). - Subtract Clara’s value from David’s value for part c).

Solution

1. The tallest bar belongs to Ben, with \(50\) points. 2. Add Anna’s and Clara’s values: \(35 + 20 = 55\) points. 3. Subtract Clara’s value from David’s value: \(45 - 20 = 25\) points.

Answer

a) Ben b) \(55\) points c) \(25\) points
5318673
A class surveyed students about their favorite ice cream flavor. Each student chose one flavor. The bar graph shows the results. a) How many students took the survey altogether? b) Which flavor received \(4\) more votes than strawberry? c) How many students chose a flavor other than chocolate?
Figure for problem 531867

Hints

- Read the height of each bar. - Add all the bar values for part a). - For part b), compare each flavor with strawberry using subtraction. - For part c), subtract the chocolate value from the total.

Solution

1. Add all the votes: \(8 + 6 + 4 + 2 + 5 = 25\) students. 2. Strawberry received \(4\) votes. Chocolate received \(8\), which is \(8 - 4 = 4\) more. 3. Subtract the chocolate votes from the total: \(25 - 8 = 17\) students.

Answer

a) \(25\) students b) Chocolate c) \(17\) students
5318753
A family recorded the number of sunny days each month from May through September. The bar graph shows the results. a) Which month had the most sunny days? How many were there? b) How many sunny days were there in June and July altogether? c) What was the difference between the number of sunny days in May and August?
Figure for problem 531875

Hints

- Read each bar using the scale, which increases by \(2\). - Find the tallest bar for part a). - Add for part b) and subtract to find the difference in part c).

Solution

1. Read the values: May, \(12\); June, \(18\); July, \(22\); August, \(20\); September, \(16\) days. 2. July has the greatest value, \(22\) sunny days. 3. Add June and July: \(18 + 22 = 40\) sunny days. 4. Subtract the May value from the August value: \(20 - 12 = 8\) days.

Answer

a) July, \(22\) sunny days b) \(40\) sunny days c) \(8\) days
5350503
A class surveyed students by asking, “How many siblings do you have?” The bar graph shows the results. a) How many students have exactly one sibling? b) How many students have more than two siblings? c) How many students are in the class altogether?
Figure for problem 535050

Hints

- The horizontal labels show the number of siblings, and each bar height shows the number of students. - “More than two” includes the categories \(3\) and \(4+\). - Add every bar height to find the class total.

Solution

1. The bar for one sibling has a height of \(12\), so \(12\) students have exactly one sibling. 2. More than two siblings includes the bars for \(3\) and \(4+\). Add them: \(2 + 1 = 3\) students. 3. Add all the bar heights: \(6 + 12 + 4 + 2 + 1 = 25\) students.

Answer

a) \(12\) students b) \(3\) students c) \(25\) students
5350523
A wildlife park recorded the number of visitors each day for one week. The bar graph shows the results from Monday through Sunday. 1. How many people visited the park on Friday? 2. On which two days did the park have the same number of visitors? 3. How many visitors came during the weekend, Saturday and Sunday, altogether?
Figure for problem 535052

Hints

- Read each bar using the vertical-axis scale. - Look for two bars that end at the same height. - Add the Saturday and Sunday values for the weekend total.

Solution

1. The Friday bar shows \(300\) visitors. 2. The Monday and Thursday bars both show \(150\) visitors. 3. Add the Saturday and Sunday values: \(450 + 550 = 1000\) visitors.

Answer

1. \(300\) visitors 2. Monday and Thursday 3. \(1000\) visitors
5350533
The bar graph shows the heights of four young trees. Each tick mark represents \(2\,\text{ft}\). a) How tall is the oak tree? b) Which tree is tallest? c) How many feet taller is the spruce than the birch?
Figure for problem 535053

Hints

- Use the scale on the vertical axis to read each bar. - Subtract the birch height from the spruce height.

Solution

1. The oak bar reaches \(14\), so the oak is \(14\,\text{ft}\) tall. 2. The tallest bar is the spruce bar at \(16\,\text{ft}\). 3. The height difference is \(16 - 8 = 8\,\text{ft}\).

Answer

a) \(14\,\text{ft}\) b) The spruce is tallest. c) \(8\,\text{ft}\)
5350593
A class collected and weighed different kinds of litter during a park cleanup. The horizontal bar graph shows the results. 1. Which kind of litter had the greatest weight? 2. How many pounds of glass and metal were collected altogether? 3. What is the difference between the weights of the paper and plastic?
Figure for problem 535059

Hints

- Read the end of each bar using the horizontal scale. - Add the two weights for question 2. - Subtract the smaller weight from the larger weight to find the difference.

Solution

1. Other trash has the longest bar, with a weight of \(50\,\text{lb}\). 2. Add the glass and metal weights: \(30 + 15 = 45\,\text{lb}\). 3. Subtract the plastic weight from the paper weight: \(45 - 25 = 20\,\text{lb}\).

Answer

1. Other trash, \(50\,\text{lb}\) 2. \(45\,\text{lb}\) 3. \(20\,\text{lb}\)
5351073
A small zoo counted its visitors from Monday through Friday. The bar graph shows the results. a) How many people visited the zoo during these five weekdays altogether? b) On which day were there \(100\) more visitors than on Wednesday? c) How many more visitors came on Friday than on Monday?
Figure for problem 535107

Hints

- Read each bar height using the vertical axis. - Add all five bar values to find the total. - For part b), compare each day with Wednesday using subtraction. - For part c), subtract Monday's value from Friday's.

Solution

1. Read the values: Monday, \(150\); Tuesday, \(200\); Wednesday, \(100\); Thursday, \(250\); Friday, \(300\). 2. Add the five values: \(150 + 200 + 100 + 250 + 300 = 1000\) visitors. 3. Tuesday had \(200 - 100 = 100\) more visitors than Wednesday. 4. Friday had \(300 - 150 = 150\) more visitors than Monday.

Answer

a) \(1000\) visitors b) Tuesday c) \(150\) visitors
5381153
Four teams collect stamps at a school fair. Each tick mark on the bar graph represents \(2\) stamps. How many more stamps does Team B have than Team C?
Figure for problem 538115

Hints

- Use the scale to read the two bars named in the question. - Subtract the smaller value from the larger value.

Solution

1. Team B has \(10\) stamps, and Team C has \(4\) stamps. 2. The difference is \(10 - 4 = 6\).

Answer

Team B has \(6\) more stamps than Team C.
5381163
The bar graph shows the fruit in a box. Each tick mark represents \(2\) pieces of fruit. How many apples and cherries are in the box altogether?
Figure for problem 538116

Hints

- Use the scale to read only the apple and cherry bars. - Add the two values.

Solution

1. The graph shows \(6\) apples and \(4\) cherries. 2. Altogether, there are \(6 + 4 = 10\) pieces of fruit.

Answer

There are \(10\) apples and cherries altogether.
5381173
A class makes paper boats in four colors. Each tick mark on the bar graph represents \(2\) boats. How many boats did the class make in all?
Figure for problem 538117

Hints

- Use the scale to read each bar. - Add all four values. Pairing two values at a time may help.

Solution

1. The four bars show \(4\), \(8\), \(2\), and \(6\) boats. 2. Pair the counts: \(4 + 8 = 12\) and \(2 + 6 = 8\). 3. The total is \(12 + 8 = 20\) boats.

Answer

The class made \(20\) paper boats in all.
5381183
Students vote for four field-trip destinations. Each tick mark on the bar graph represents \(2\) votes. Put the destinations in order from the most votes to the fewest votes.
Figure for problem 538118

Hints

- Use the scale to read each bar. - Order the bars from longest to shortest.

Solution

1. The graph shows lake: \(8\), forest: \(6\), mountain: \(4\), and fort: \(2\). 2. From greatest to least, the order is lake, forest, mountain, fort.

Answer

Lake, forest, mountain, fort.
5381193
Five students count their jump-rope jumps in ten seconds. Each tick mark on the bar graph represents \(2\) jumps. a) Who makes at least \(8\) jumps? b) How many students is that?
Figure for problem 538119

Hints

- Use the scale to read each student's bar. - Find bars that reach \(8\) or higher, then count them.

Solution

1. Noah and Ben each make \(10\) jumps, which is at least \(8\). 2. The other students make fewer than \(8\) jumps. 3. Therefore, \(2\) students make at least \(8\) jumps.

Answer

a) Noah and Ben make at least \(8\) jumps. b) That is \(2\) students.
5381223
The graph shows how much water is in a rain barrel on four days. The goal for Thursday is \(70\,\text{gal}\). How many more gallons are needed?
Figure for problem 538122

Hints

- Read the Thursday value from the graph. - Compare that value with the goal. - Subtract to find how much is still needed.

Solution

1. The Thursday bar shows \(40\,\text{gal}\). 2. The amount still needed is \(70 - 40 = 30\,\text{gal}\).

Answer

\(30\,\text{gal}\) more are needed.
5381313
Team Beaver wants to have the same number of research points as Team Otter. How many more points does Team Beaver need?
Figure for problem 538131

Hints

- Read the two team scores from the graph. - Find the difference between the scores. - Check that adding your answer to Team Beaver's score makes the scores equal.

Solution

1. Team Beaver has \(15\) points, and Team Otter has \(20\) points. 2. The number needed is \(20 - 15 = 5\) points.

Answer

Team Beaver needs \(5\) more points.
5381343
The scale increases by tens. How many minutes of practice were recorded on Tuesday and Thursday altogether?
Figure for problem 538134

Hints

- Read the Tuesday and Thursday bars. - Remember that the scale increases by \(10\). - Add the two values.

Solution

1. Tuesday shows \(40\) minutes, and Thursday shows \(50\) minutes. 2. Altogether, \(40 + 50 = 90\,\text{min}\).

Answer

\(90\,\text{min}\) of practice were recorded altogether.
5381393
Six more rings are added to the equipment room. Which other kind of equipment will then have the same number as the rings?
Figure for problem 538139

Hints

- Increase only the number of rings. - Find the new number of rings. - Compare that number with the other bars.

Solution

1. The number of rings changes from \(12\) to \(12 + 6 = 18\). 2. The graph shows \(18\) balls. 3. Therefore, there will be the same number of rings and balls.

Answer

There will be the same number of rings and balls.
5381493
The graph shows the number of open lounge chairs at a public pool. How did the number change from \(8{:}00\) a.m. to \(4{:}00\) p.m.?
Figure for problem 538149

Hints

- Read the first and last times named in the question. - Subtract the earlier value from the later value. - State whether the number increased or decreased.

Solution

1. At \(8{:}00\) a.m., \(10\) chairs are open. At \(4{:}00\) p.m., \(15\) chairs are open. 2. The change is \(15 - 10 = 5\) chairs, an increase.

Answer

At \(4{:}00\) p.m., there are \(5\) more open chairs than at \(8{:}00\) a.m.
5381503
On which two days were the same number of pool tickets sold?
Figure for problem 538150

Hints

- Read the value of each bar. - Look for two bars with the same height. - Name both matching days.

Solution

1. The Tuesday and Thursday bars both have a value of \(15\). 2. The other days have different values.

Answer

On Tuesday and Thursday, \(15\) tickets were sold each day.
5381533
At least \(15\) of each kind of supply is needed. Which supplies already have enough in stock?
Figure for problem 538153

Hints

- Read each bar value. - “At least \(15\)” includes exactly \(15\). - Select every supply with a value of \(15\) or more.

Solution

1. Scissors have \(15\), and markers have \(20\), so both meet the requirement. 2. Tape and paintbrushes each have only \(10\), so they do not meet the requirement.

Answer

There are enough scissors and markers.
5381593
How many packages were picked up on Monday, Wednesday, and Friday altogether?
Figure for problem 538159

Hints

- Read only the Monday, Wednesday, and Friday bars. - Add the three values. - Check that your total is greater than each single value.

Solution

1. The three values are \(6\), \(8\), and \(10\). 2. Their sum is \(6 + 8 + 10 = 24\).

Answer

\(24\) packages were picked up altogether.
5381613
The graph shows the lengths of four scooter routes in yards. How much longer is Route \(2\) than Route \(4\)?
Figure for problem 538161

Hints

- Read the lengths of Routes \(2\) and \(4\). - Subtract the shorter route from the longer route. - Include the unit in your answer.

Solution

1. Route \(2\) is \(180\,\text{yd}\) long, and Route \(4\) is \(90\,\text{yd}\) long. 2. The difference is \(180 - 90 = 90\,\text{yd}\).

Answer

Route \(2\) is \(90\,\text{yd}\) longer.
5381753
Which color has exactly the same value in both graphs?
Figure for problem 538175

Hints

- Compare one color at a time. - Read its value in both graphs. - Look for an exact match.

Solution

1. Blue has a value of \(20\) in Graph a). 2. Blue also has a value of \(20\) in Graph b). 3. The other colors have different values in the two graphs.

Answer

Blue has the same value in both graphs.
5381793
Compare Graphs a) and b). 1) Who is in the lead in Graph a)? 2) Who is in the lead in Graph b)? 3) Did the leader change?
Figure for problem 538179

Hints

- Find the tallest bar in each graph. - Match each tallest bar to its team. - Compare the two team names.

Solution

1. In a), Team Owl has the greatest score, \(30\). 2. In b), Team Fox has the greatest score, \(35\). 3. Therefore, the leader changed.

Answer

1) Team Owl leads in Graph a). 2) Team Fox leads in Graph b). 3) Yes, the leader changed.
5381823
In Graph b), the four values from Graph a) were rearranged. 1) Which value moved from A to C? 2) Which value moved from B to D? 3) Which value moved from C to A? 4) Which value moved from D to B?
Figure for problem 538182

Hints

- Match equal values across the two graphs. - Follow each starting bar named in the question. - Record all four value moves.

Solution

1. A in a) and C in b) both have \(12\). 2. B in a) and D in b) both have \(18\). 3. C in a) and A in b) both have \(24\). 4. D in a) and B in b) both have \(30\).

Answer

1) A to C: \(12\) 2) B to D: \(18\) 3) C to A: \(24\) 4) D to B: \(30\)
5381843
The graphs show snails found on three weekdays in two different weeks. How many snails were found on the two Wednesdays altogether?
Figure for problem 538184

Hints

- Find Wednesday in both graphs. - Read the two values. - Add them.

Solution

1. Wednesday has a value of \(15\) in a) and \(25\) in b). 2. Altogether, \(15 + 25 = 40\) snails were found.

Answer

\(40\) snails were found on the two Wednesdays altogether.
5382133
Students counted birds at a school pond. <table><tr><th>Bird</th><th>Number seen</th></tr><tr><td>Duck</td><td>\(8\)</td></tr><tr><td>Robin</td><td>\(5\)</td></tr><tr><td>Sparrow</td><td>\(14\)</td></tr><tr><td>Heron</td><td>\(3\)</td></tr></table> A bar graph will use the categories in the order shown and increments of \(1\) on the number scale. What should the height of each bar be?

Hints

- Read the table headings and category labels carefully. - Keep the categories in the same order as the table.

Solution

1. Keep the bird categories in the order shown in the table. 2. Match each category to its value. 3. Use these bar heights: Duck, \(8\); Robin, \(5\); Sparrow, \(14\); Heron, \(3\).

Answer

Duck: \(8\), Robin: \(5\), Sparrow: \(14\), Heron: \(3\).
5382143
Audiobooks checked out: <table><tr><th>Day</th><th>Number checked out</th></tr><tr><td>Mon</td><td>\(6\)</td></tr><tr><td>Tue</td><td>\(9\)</td></tr><tr><td>Wed</td><td>\(4\)</td></tr><tr><td>Thu</td><td>\(11\)</td></tr><tr><td>Fri</td><td>\(7\)</td></tr></table> A bar graph will show the weekdays from Monday through Friday. List the five bar heights in that order and give a reasonable maximum for the number axis.

Hints

- Think about what equal spacing on the number axis represents. - Make sure the axis maximum is at least as great as every data value.

Solution

1. Match each weekday to its value in the table. 2. The bar heights, from Monday through Friday, are \(6, 9, 4, 11, 7\). 3. A maximum of \(12\) is reasonable because it is just above the greatest value and allows an even scale.

Answer

The bar heights are \(6, 9, 4, 11, 7\). A reasonable axis maximum is \(12\).
5382223
Passengers boarding a local bus: <table><tr><th>Stop</th><th>Passengers</th></tr><tr><td>Stop 1</td><td>\(15\)</td></tr><tr><td>Stop 2</td><td>\(32\)</td></tr><tr><td>Stop 3</td><td>\(26\)</td></tr><tr><td>Stop 4</td><td>\(9\)</td></tr></table> A bar graph needs short labels below the bars. Suggest four clear short labels and match each label to the correct bar height.

Hints

- Decide which information belongs on each axis. - Check that each shortened label still identifies exactly one stop.

Solution

1. Shorten each stop name without changing its number. 2. One clear set of labels is S1, S2, S3, and S4. 3. Match the labels to the values: S1, \(15\); S2, \(32\); S3, \(26\); S4, \(9\).

Answer

For example: S1: \(15\), S2: \(32\), S3: \(26\), S4: \(9\).
5382243
Pages in chapters of a class novel: <table><tr><th>Chapter</th><th>Pages</th></tr><tr><td>Chapter 1</td><td>\(12\)</td></tr><tr><td>Chapter 2</td><td>\(18\)</td></tr><tr><td>Chapter 3</td><td>\(15\)</td></tr><tr><td>Chapter 4</td><td>\(21\)</td></tr></table> The vertical axis of a bar graph will use intervals of \(3\). List every labeled value from \(0\) to the smallest possible maximum, and then list the bar heights.

Hints

- Consider both the bar values and the scale interval. - Make sure the axis starts at \(0\) and reaches the greatest value.

Solution

1. The greatest bar height is \(21\), which is already a multiple of \(3\), so the smallest possible maximum is \(21\). 2. Count by threes from \(0\): \(0, 3, 6, 9, 12, 15, 18, 21\). 3. In table order, the bar heights are \(12, 18, 15, 21\).

Answer

Axis labels: \(0, 3, 6, 9, 12, 15, 18, 21\). Bar heights: \(12, 18, 15, 21\).
5382273
For a community bike challenge, a bar graph’s vertical axis is labeled \(0, 40, 80, ?, 160, 200\). Fill in the missing value. How many grid intervals long are bars representing \(80, 120, 200, 160\) miles?

Hints

- First describe the pattern in the axis labels. - Then compare each bar value with the size of one interval.

Solution

1. The axis increases by \(40\) each time, so the missing value is \(120\). 2. Divide each bar value by \(40\): \(80 \div 40 = 2\), \(120 \div 40 = 3\), \(200 \div 40 = 5\), and \(160 \div 40 = 4\).

Answer

The missing value is \(120\). The bars extend across \(2, 3, 5, 4\) intervals, respectively.
5382303
A flower-count bar graph has exactly \(5\) equal grid intervals from \(0\) to \(40\). Find the size of each interval. How many intervals long are bars with heights \(16, 24, 32, 40\)?

Hints

- Use both the scale maximum and the number of equal intervals. - Check that the interval size reaches from \(0\) to \(40\) in exactly \(5\) steps.

Solution

1. Divide the full scale by the number of intervals: \(40 \div 5 = 8\). Each interval represents \(8\). 2. Divide each bar height by \(8\). The bars extend across \(2, 3, 4, 5\) intervals, respectively.

Answer

Each interval represents \(8\). The bars extend across \(2, 3, 4, 5\) intervals, respectively.
5382353
A bar graph's vertical axis is labeled \(0, 16, 32, 48, 64, 80\). Four postcard bars have heights of \(32, 48, 64, 80\). Match each height to the number of grid intervals it spans.

Hints

- Trace the labeled axis from \(0\) upward one interval at a time. - Count spaces between neighboring gridlines, not the number of labels. - Match each bar height to the number of equal jumps needed to reach it from \(0\).

Solution

1. Each pair of neighboring labels marks one grid interval. 2. From \(0\) to \(32\) there are \(2\) intervals: \(0\) to \(16\), then \(16\) to \(32\). 3. Continuing the same count, \(48\) spans \(3\) intervals, \(64\) spans \(4\), and \(80\) spans \(5\).

Answer

\(32\): \(2\) intervals; \(48\): \(3\) intervals; \(64\): \(4\) intervals; \(80\): \(5\) intervals.
5382393
The graph shows how many laps four children completed in swim class. The bar heights are correct, but the vertical axis is labeled “Minutes.” What must be changed?
Figure for problem 538239

Hints

- Describe what the graph is measuring. - Then compare that quantity with the current axis label.

Solution

1. The values count laps, not units of time. 2. The vertical axis should be labeled “Laps” instead of “Minutes.”

Answer

Change the vertical-axis label from “Minutes” to “Laps.”
5382403
The table shows the number of shells collected by four students. <table><tr><th>Student</th><th>Shells</th></tr><tr><td>Ira</td><td>\(13\)</td></tr><tr><td>Leo</td><td>\(8\)</td></tr><tr><td>Nia</td><td>\(17\)</td></tr><tr><td>Sam</td><td>\(11\)</td></tr></table> Exactly one category is missing from the bar graph. Which bar must be added?
Figure for problem 538240

Hints

- Compare every name in the table with the names in the graph. - Use the table value to determine the height of the missing bar.

Solution

1. The graph includes bars for Ira, Leo, and Sam. 2. Comparing the graph with the table shows that Nia is missing. Her bar must have a height of \(17\).

Answer

Add a bar for Nia with a height of \(17\).
5382413
The bars show the correct numbers of pictures taken from Monday through Thursday, but the days should appear in chronological order. Which two bars must switch places?
Figure for problem 538241

Hints

- List the weekdays in chronological order. - Compare that order with the order of the bars in the graph.

Solution

1. In the graph, Tuesday appears before Monday. 2. Monday and Tuesday must switch places. Wednesday and Thursday are already in the correct order.

Answer

The bars labeled Mon and Tue must switch places.
5382463
A coach thinks the jump-rope bar graph contains a data-entry error. Compare all four bars with the table and state the one correction that is needed. <table><tr><th>Student</th><th>Correct value</th></tr><tr><td>Eli</td><td>\(50\)</td></tr><tr><td>Kim</td><td>\(70\)</td></tr><tr><td>Luz</td><td>\(60\)</td></tr><tr><td>Noa</td><td>\(80\)</td></tr></table>
Figure for problem 538246

Hints

- Check each student’s graph value against the table. - Identify the only mismatch and state both the displayed and correct values.

Solution

1. Compare each bar with the corresponding table value. 2. Eli, Kim, and Noa match the table. Luz does not. 3. Luz’s bar shows \(70\), but the table gives \(60\). Lower the bar to \(60\).

Answer

Luz’s bar is too high. It shows \(70\), but it should show \(60\).
5382473
A bar graph of visits to a community center will show the values \(16, 24, 20, 28\). The planned vertical axis ends at \(24\). What is the problem? If the axis uses intervals of \(4\), choose the smallest suitable maximum.

Hints

- Compare the greatest data value with the planned axis maximum. - Make sure the new maximum belongs to the scale pattern.

Solution

1. The value \(28\) is greater than the planned maximum of \(24\), so that bar would extend beyond the axis. 2. Since \(28\) is a multiple of \(4\), the smallest suitable maximum is \(28\).

Answer

The axis is too short. With intervals of \(4\), it must extend to at least \(28\).
5382493
The bar graph shows the number of birdhouses at Locations A through D. Three birdhouses are added at Location B. What is the new height of bar B, and is it now the tallest bar?
Figure for problem 538249

Hints

- Read bar B's starting value from the graph. - Increase only bar B by the stated amount. - Compare the new bar B height with the other displayed bars.

Solution

1. Read bar B's current height from the graph: \(9\). 2. Add the new birdhouses: \(9 + 3 = 12\). 3. The other bar heights are \(6\), \(4\), and \(8\), so none is greater than \(12\).

Answer

Bar B has height \(12\) and is the tallest bar.
5382513
In a memory card game, \(2\) green cards are removed. How long is the Green bar afterward? Which other bar is then the same length?
Figure for problem 538251

Hints

- First identify the original Green value. - After subtracting, compare the new value with the other bars.

Solution

1. Subtract the removed cards from the Green value: \(20 - 2 = 18\). 2. The Red bar also has length \(18\).

Answer

The Green bar has length \(18\) and is then the same length as the Red bar.
5382543
Jon runs \(5\) more laps. After that change, order the four bars from longest to shortest.
Figure for problem 538254

Hints

- Add \(5\) to Jon’s original value. - Compare all four values and order them from greatest to least.

Solution

1. Jon’s new value is \(9 + 5 = 14\) laps. 2. Order the values from greatest to least: Jon, \(14\); Tao, \(12\); Pia, \(11\); Mia, \(8\).

Answer

Jon: \(14\); Tao: \(12\); Pia: \(11\); Mia: \(8\)
5382593
Three more boats arrive in the Bay area. What will the new length of the Bay bar be? What will the sum of all four bar values be after the change?
Figure for problem 538259

Hints

- Update the Bay value first. - Then add all four values, using the updated Bay value.

Solution

1. The Bay value becomes \(10 + 3 = 13\) boats. 2. Add the four updated values: \(9 + 12 + 7 + 13 = 41\) boats.

Answer

The Bay bar will have a length of \(13\), and the sum will be \(41\).
5382623
Graph a) uses vertical bars, and graph b) uses horizontal bars. Both show the same bike-rental data. Are both graphs mathematically correct? Give one reason graph b) might be more practical.
Figure for problem 538262

Hints

- Check whether both graphs match the same categories with the same values. - Think about which orientation leaves more room for long labels.

Solution

1. Both graphs match Monday, Tuesday, and Wednesday with the values \(12, 8, 16\), respectively. 2. Therefore, both graphs represent the data correctly. 3. A horizontal bar graph can provide more space for long category labels.

Answer

Both graphs are correct. Horizontal bars can be more practical when category labels are long.
5382633
Both graphs show the same cloud-count values. In which graph can all three values be read directly at gridlines? Explain using the value \(11\).
Figure for problem 538263

Hints

- Compare the grid interval used in each graph. - Locate where \(11\) would fall on each scale.

Solution

1. Graph a) uses intervals of \(1\), so every whole-number value lies on a gridline. 2. Graph b) uses intervals of \(2\). The value \(11\) lies between the gridlines at \(10\) and \(12\). 3. Therefore, all three values can be read directly at gridlines in graph a).

Answer

Graph a). It uses intervals of \(1\), while \(11\) falls between \(10\) and \(12\) in graph b).
5382653
Three graphs claim to show these animal counts: Chicken, \(20\); Sheep, \(9\); Pony, \(4\). Choose the correct graph and support your choice using the greatest and least values.
Figure for problem 538265

Hints

- Identify the greatest and least values first. - Then check whether every animal is matched with its correct bar height.

Solution

1. Chicken must have the tallest bar, with a value of \(20\). 2. Pony must have the shortest bar, with a value of \(4\), and Sheep must have a value of \(9\). 3. Only graph b) matches all three category-value pairs.

Answer

Graph b) is correct. Chicken has the greatest value, \(20\), and Pony has the least value, \(4\).
5382673
The bar heights are correct, but the vertical axis has no label. Stones were counted in a creek. What label is missing, and why would “Weight” be incorrect?
Figure for problem 538267

Hints

- Identify what quantity the graph represents. - Compare that quantity with the meaning of each possible label.

Solution

1. The values represent counts of stones. 2. Therefore, the missing label should be “Number of stones.” The label “Weight” would describe a different quantity that was not measured.

Answer

The missing label is “Number of stones.” “Weight” is incorrect because the stones were counted, not weighed.
5382743
Four paths have lengths of \(120, 80, 150, 100\). Which label belongs on the vertical axis: “Paths,” “Feet,” or “Minutes”? What belongs on the horizontal axis?

Hints

- Separate the categories from the measured quantity. - A length needs an appropriate unit of length.

Solution

1. The measured quantity is length, and its unit is feet. 2. The categories are the four paths.

Answer

Vertical axis: “Feet”; horizontal axis: “Paths.”
5382763
A museum graph shows child visits on Tuesday, Wednesday, Thursday, and Friday. The axis labels are switched: “Child visits” appears below the bars, and “Days” appears on the vertical axis. Correct both labels.

Hints

- Decide which information is categorical and which is numerical. - Check that each axis label matches the information shown on that axis.

Solution

1. The categories below the bars are the days. 2. The bar heights represent numbers of child visits.

Answer

Horizontal axis: “Days”; vertical axis: “Child visits.”
5382773
In a sunflower bar graph, the labels below the bars are only A, B, C, and D. The letters represent garden plots. What addition would make the short labels clear? Also give an appropriate label for the vertical axis.

Hints

- Identify what the letters stand for. - Make sure the vertical-axis label names the quantity being counted.

Solution

1. Add a key or note explaining that A through D are garden plots. 2. The vertical axis represents a count of sunflowers.

Answer

Add “A–D: Garden plots.” Label the vertical axis “Number of sunflowers.”
5382823
On a graph of bicycle repairs, every tick mark is labeled “5 bicycles,” “10 bicycles,” “15 bicycles,” and so on. How can the labels be made shorter and easier to read?

Hints

- Decide which information belongs in the axis label. - Avoid repeating the same unit at every tick mark.

Solution

1. The unit does not need to be repeated beside every tick value. 2. Label the vertical axis once as “Bicycles repaired” and use only numbers at the tick marks.

Answer

Label the vertical axis “Bicycles repaired” once, and label the tick marks with numbers only.
5382953
Trees along city streets: <table><tr><th>Tree type</th><th>Number</th></tr><tr><td>Linden</td><td>\(22\)</td></tr><tr><td>Oak</td><td>\(18\)</td></tr><tr><td>Maple</td><td>\(26\)</td></tr><tr><td>Birch</td><td>\(14\)</td></tr></table> Add a Pine category with a value of \(20\). How many bars will the new graph have, and what will their heights be?

Hints

- Count the existing categories and the new category. - Keep every original value and add the new value in the stated category.

Solution

1. Adding Pine to the four existing categories creates a fifth category. 2. The graph will have \(5\) bars. 3. The heights are Linden, \(22\); Oak, \(18\); Maple, \(26\); Birch, \(14\); Pine, \(20\).

Answer

There will be \(5\) bars: Linden: \(22\), Oak: \(18\), Maple: \(26\), Birch: \(14\), Pine: \(20\).
5382983
Five evenly spaced gridlines are labeled \(0, 5, 12, 15, 20\). Find the incorrect label and replace it.

Hints

- Determine what equal spacing means for the numerical pattern. - Check that the difference between consecutive labels is constant.

Solution

1. Equal spacing from \(0\) to \(20\) across four intervals means the labels should increase by \(5\). 2. The middle label should therefore be \(10\), not \(12\).

Answer

Replace \(12\) with \(10\).
5383013
A graph shows pages read on four days. Both axes are incorrectly labeled “Days.” Give an appropriate label for each axis.

Hints

- Separate the categories from the numerical quantity. - Check that each axis label describes the information shown there.

Solution

1. The horizontal axis lists the categories, which are the days. 2. The vertical axis shows how many pages were read.

Answer

Horizontal axis: “Days”; vertical axis: “Pages read.”
5383023
The values \(10, 20, 30\) belong to three different categories, but the bars touch with no spaces between them. Why are visible spaces appropriate here?

Hints

- Decide whether the values represent separate categories or connected intervals. - Think about how spacing helps readers distinguish the categories.

Solution

1. The bars represent separate categories rather than connected numerical intervals. 2. Visible spaces help show that the categories are distinct.

Answer

The bars should have visible spaces because they represent separate categories.
5383043
Equal grid intervals on a vertical axis represent increases of \(2\), then \(5\), then \(2\). What basic rule is being broken, and how should the axis be fixed?

Hints

- Determine what equal physical spacing should mean on a vertical axis. - Check whether the numerical differences stay constant.

Solution

1. The numerical interval changes even though the physical grid spacing stays the same. 2. Every equal grid interval must represent the same numerical increase.

Answer

The scale interval is inconsistent. Every equal grid interval must represent the same numerical increase.
5402393
The bar graph shows how many items a museum gift shop sold on Saturday. How many more magnets than postcards were sold?
Figure for problem 540239

Hints

- Use the vertical scale to read the height of the Postcards bar. - Read the height of the Magnets bar in the same way. - Subtract the smaller count from the larger count to find “how many more.”

Solution

1. Read the bars: \(24\) magnets and \(16\) postcards were sold. 2. Find the difference: \(24 - 16 = 8\).

Answer

The shop sold \(8\) more magnets than postcards.
5402943
The bar graph shows how many science books three classes read. a) How many books did the three classes read altogether? b) How many more books did Class C read than Class A?
Figure for problem 540294

Hints

- Read each bar using the scale that counts by twos. - Add all three bar values for the total. - Compare Class C with Class A by subtraction.

Solution

1. Read the bars: Class A read \(6\) books, Class B read \(8\), and Class C read \(10\). 2. For part a), add: \(6 + 8 + 10 = 24\). 3. For part b), subtract: \(10 - 6 = 4\).

Answer

a) \(24\) books b) \(4\) more books
5403603
The bar graph shows the number of books three students read during a month. How many books did they read altogether?
Figure for problem 540360

Hints

- Use the vertical scale, which counts by threes, to read each bar. - Record all three bar values before adding. - Combine the three counts to find the total.

Solution

1. Read the bars: Ava read \(12\) books, Ben read \(9\), and Cora read \(6\). 2. Add the values: \(12 + 9 + 6 = 27\).

Answer

They read \(27\) books altogether.
5404113
The scaled bar graph shows the numbers of shells found at two locations. a) How many shells were found altogether? b) How many more shells were found at Sandy Beach than at Tide Pool?
Figure for problem 540411

Hints

- Use the horizontal scale, which counts by fours, to read each bar. - Add the two bar values for the total. - Subtract the Tide Pool value from the Sandy Beach value to find “how many more.”

Solution

1. Read the bars: Tide Pool has \(12\) shells, and Sandy Beach has \(20\) shells. 2. For part a), add: \(12 + 20 = 32\). 3. For part b), subtract: \(20 - 12 = 8\).

Answer

a) \(32\) shells b) \(8\) more shells
5548543
A class will make a scaled bar graph from this table. <table><tr><th>Activity</th><th>Students</th></tr><tr><td>Board games</td><td>\(6\)</td></tr><tr><td>Cards</td><td>\(0\)</td></tr><tr><td>Puzzles</td><td>\(9\)</td></tr><tr><td>Reading</td><td>\(3\)</td></tr></table> The vertical scale will increase by \(3\) students per grid interval. Give a complete construction specification: state the horizontal-axis category labels, the vertical-axis quantity and numerical labels from \(0\) through the greatest value, and the number of grid intervals high each bar must be.

Hints

- Use the table for the category names, but use the stated scale to determine the numerical axis labels. - Translate each student count into a number of equal \(3\)-student grid intervals. - Keep the zero category on the horizontal axis even though its bar has height \(0\).

Solution

1. The horizontal axis should list the four activity categories: Board games, Cards, Puzzles, and Reading. 2. The vertical axis represents the number of students. With \(3\) students per interval and a greatest value of \(9\), its labels are \(0, 3, 6, 9\). 3. Board games has \(6\) students, so its bar is \(2\) grid intervals high. 4. Cards has \(0\) students, so its bar is \(0\) intervals high while the category label remains. 5. Puzzles has \(9\) students, so its bar is \(3\) intervals high. 6. Reading has \(3\) students, so its bar is \(1\) interval high.

Answer

Horizontal-axis labels: Board games, Cards, Puzzles, Reading Vertical axis: number of students, labeled \(0, 3, 6, 9\) Bar heights in grid intervals: Board games \(2\), Cards \(0\), Puzzles \(3\), Reading \(1\)
5548553
A picture graph will be converted into a scaled bar graph. <table><tr><th>Insect</th><th>Picture graph</th></tr><tr><td>Butterflies</td><td>● ● ●</td></tr><tr><td>Bees</td><td>● ●</td></tr><tr><td>Ladybugs</td><td>● ● ● ●</td></tr></table> Key: ● = \(2\) insects What should the three bar heights be? Then choose the **largest** interval from \(1, 2, 4\) that places every bar endpoint on a gridline.

Hints

- Use the picture-graph key to convert each row into a data value. - Those data values become the bar heights. - Test each candidate scale interval against all three heights, then choose the largest one that works.

Solution

1. Butterflies represent \(3 \times 2 = 6\), bees represent \(2 \times 2 = 4\), and ladybugs represent \(4 \times 2 = 8\). 2. Intervals of \(1\) work for all three values. 3. Intervals of \(2\) also work for \(6, 4, 8\). 4. Intervals of \(4\) do not work for \(6\). 5. Therefore, \(2\) is the largest listed interval that works.

Answer

Bar heights: butterflies \(6\), bees \(4\), ladybugs \(8\). Use an interval of \(2\).
5316893
A bar graph shows the number of visitors to a wildlife park from Monday through Friday. a) How many people visited the park on Thursday? b) How many more visitors came on Friday than on Monday? c) How many visitors came to the park from Monday through Friday altogether?
Figure for problem 531689

Hints

- Use the vertical-axis scale to determine the value of each interval. - Find the bar for the requested day and read its height. - Use subtraction to compare two bars. - Add all five bar values to find the total.

Solution

1. Read the values from the vertical axis: Monday, \(150\); Tuesday, \(250\); Wednesday, \(200\); Thursday, \(350\); Friday, \(450\). 2. Thursday’s bar shows \(350\) visitors. 3. Find the difference between Friday and Monday: \(450 - 150 = 300\) visitors. 4. Add all five values: \(150 + 250 + 200 + 350 + 450 = 1400\) visitors.

Answer

a) \(350\) visitors b) \(300\) more visitors c) \(1400\) visitors
5316903
A Grade 3 class surveyed students about their favorite fruit. The bar graph shows the results. Each student cast exactly one vote. a) Which fruit was most popular, and how many votes did it receive? b) How many votes did bananas receive? c) How many more votes did apples receive than pears? d) How many students participated in the survey altogether?
Figure for problem 531690

Hints

- This bar graph is horizontal, so bar length represents the number of votes. - Use the horizontal axis to read the value of each bar. - Subtract the two bar values to find how many more votes one fruit received. - Add all four bar values to find the total number of votes.

Solution

1. Read each bar using the horizontal scale: strawberries, \(10\) votes; apples, \(8\) votes; bananas, \(6\) votes; pears, \(4\) votes. 2. Strawberries have the longest bar, so they were most popular with \(10\) votes. 3. The banana bar shows \(6\) votes. 4. Find the difference between apples and pears: \(8 - 4 = 4\) votes. 5. Add all four values: \(10 + 8 + 6 + 4 = 28\) students.

Answer

a) Strawberries, \(10\) votes b) \(6\) votes c) \(4\) more votes d) \(28\) students
5316913
During summer break, five students participated in a public library reading challenge. The horizontal bar graph shows how many books each student read. a) Which student read the most books? How many books did that student read? b) How many books did the five students read altogether? c) Noah and Ethan together read the same number of books as Mia. Is that statement true? Use the graph data to justify your answer.
Figure for problem 531691

Hints

- Use the horizontal-axis scale to read each bar endpoint. - Identify the longest bar for part a). - Add all five values for the total. - For part c), combine Noah's and Ethan's values before comparing with Mia's.

Solution

1. Read the values from the graph: Ethan, \(10\); Noah, \(5\); Mia, \(15\); Leo, \(8\); Julia, \(12\). 2. Mia has the greatest value, \(15\) books. 3. Add the five values: \(10 + 5 + 15 + 8 + 12 = 50\) books. 4. Noah and Ethan read \(5 + 10 = 15\) books altogether, which matches Mia's \(15\) books.

Answer

a) Mia, \(15\) books b) \(50\) books c) Yes. Noah and Ethan read \(15\) books altogether, the same as Mia.
5317033
A class survey asked each student to choose one favorite sport. The bar graph shows the results. Each tick mark represents \(2\) students. a) How many students chose soccer? b) How many students chose gymnastics or swimming? c) How many students took the survey in all?
Figure for problem 531703

Hints

- Use the scale on the vertical axis to read each bar. - Add only the bars named in each question.

Solution

1. Read the bars using the scale: soccer: \(6\), swimming: \(4\), gymnastics: \(2\), and biking: \(2\). 2. For a), the soccer bar shows \(6\) students. 3. For b), \(2 + 4 = 6\) students chose gymnastics or swimming. 4. For c), \(6 + 4 + 2 + 2 = 14\) students took the survey.

Answer

a) \(6\) students b) \(6\) students c) \(14\) students
5317083
The bar graph shows the height of a sunflower measured at the end of each week. a) How tall was the sunflower at the end of Week 3? b) From Week 2 through Week 5, during which week did the sunflower grow the most compared with the previous week? How many centimeters did it grow during that week?
Figure for problem 531708

Hints

- Read each weekly height from the vertical axis. - Subtract consecutive weekly heights to find each week’s growth. - Compare the increases to identify the greatest one.

Solution

1. Read the Week 3 bar: the sunflower was \(45\,\text{cm}\) tall. 2. Find each weekly increase: Week 2, \(25 - 10 = 15\,\text{cm}\); Week 3, \(45 - 25 = 20\,\text{cm}\); Week 4, \(60 - 45 = 15\,\text{cm}\); Week 5, \(70 - 60 = 10\,\text{cm}\). 3. The greatest increase was \(20\,\text{cm}\), during Week 3.

Answer

a) \(45\,\text{cm}\) b) Week 3; \(20\,\text{cm}\)
5317843
The Rivera family has solar panels on the roof of their home. The graph shows how much electricity the panels generated, in kilowatt-hours, on each day of one week in June. a) How much electricity did the panels generate during the entire week? b) On how many days did the panels generate more than \(15\,\text{kWh}\)? c) Give one possible reason the electricity generated on Wednesday and Thursday was much lower than on the other days.
Figure for problem 531784

Hints

- Read the value for every day from the vertical axis. - Add the daily values to find the weekly total. - Compare each bar with \(15\,\text{kWh}\) and count only the bars above it. - Think about what affects solar-panel output.

Solution

1. Read the daily values: Monday, \(18\,\text{kWh}\); Tuesday, \(22\,\text{kWh}\); Wednesday, \(5\,\text{kWh}\); Thursday, \(7\,\text{kWh}\); Friday, \(12\,\text{kWh}\); Saturday, \(20\,\text{kWh}\); Sunday, \(21\,\text{kWh}\). 2. Add all seven values: \(18 + 22 + 5 + 7 + 12 + 20 + 21 = 105\,\text{kWh}\). 3. The values above \(15\,\text{kWh}\) occur on Monday, Tuesday, Saturday, and Sunday, for a total of \(4\) days. 4. One possible reason for the low values on Wednesday and Thursday is cloudy or rainy weather that reduced sunlight.

Answer

a) \(105\,\text{kWh}\) b) \(4\) days c) For example, cloudy or rainy weather reduced the sunlight reaching the panels.
5317973
Four students read books during summer break. The graph shows how many books each student read. Answer the questions. a) Which student read the most books, and which read the fewest? b) How many books did all four students read altogether? c) How many more books would Jonah need to read to equal the combined total read by Mia and Leo?
Figure for problem 531797

Hints

- Read each student’s bar value carefully. - Add all four values for part b). - For part c), first combine Mia’s and Leo’s values, and then compare that total with Jonah’s value.

Solution

1. Read the values: Mia, \(12\); Leo, \(8\); Sophia, \(15\); Jonah, \(6\) books. 2. Sophia has the greatest value, \(15\), and Jonah has the least, \(6\). 3. Add all four values: \(12 + 8 + 15 + 6 = 41\) books. 4. Mia and Leo read \(12 + 8 = 20\) books. Jonah needs \(20 - 6 = 14\) more books.

Answer

a) Sophia read the most, \(15\) books; Jonah read the fewest, \(6\) books. b) \(41\) books c) \(14\) more books
5318623
A class surveyed how many books students read during summer break. The bar graph shows the results. The horizontal axis shows the number of books read. The vertical axis shows the number of students. a) How many students read exactly \(3\) books? b) How many students took the survey altogether? c) How many students read more than \(3\) books? d) Which number of books was reported most often? How many students reported that number?
Figure for problem 531862

Hints

- Use the horizontal axis to find the number of books and the vertical axis to read the number of students. - Add every bar height for the total. - “More than \(3\)” does not include \(3\). - Find the tallest bar for part d).

Solution

1. The bar at \(3\) books has a height of \(6\), so \(6\) students read exactly \(3\) books. 2. Add all the bar heights: \(2 + 5 + 8 + 6 + 4 + 3 = 28\) students. 3. More than \(3\) books means \(4\) or \(5\) books. Add those bar heights: \(4 + 3 = 7\) students. 4. The tallest bar is at \(2\) books and has a height of \(8\).

Answer

a) \(6\) students b) \(28\) students c) \(7\) students d) \(2\) books, reported by \(8\) students
5318743
Students chose their favorite sport in a school survey. Each student chose one sport. The bar graph shows the results. a) How many students took the survey altogether? b) Which sport was most popular? How many votes did it receive? c) How many students chose swimming or gymnastics? d) How many more students chose soccer than track?
Figure for problem 531874

Hints

- Read each bar using the horizontal-axis scale. - Add all five values for part a). - Add the two named categories for part c). - Subtract the track value from the soccer value for part d).

Solution

1. Add all the votes: \(16 + 12 + 8 + 6 + 4 = 46\) students. 2. Soccer has the longest bar, with \(16\) votes. 3. Add the swimming and gymnastics votes: \(12 + 8 = 20\) students. 4. Subtract the track votes from the soccer votes: \(16 - 6 = 10\) students.

Answer

a) \(46\) students b) Soccer, \(16\) votes c) \(20\) students d) \(10\) more students
5350423
A class surveyed students about their favorite free-time activity. The bar graph shows the results. a) Which activity is most popular? b) How many students took the survey altogether? c) How many students chose swimming or dancing? d) How many additional votes would riding need to have the same number of votes as soccer?
Figure for problem 535042

Hints

- Read each bar using the vertical-axis scale. - Add all four values for part b). - Add the two named categories for part c). - Find the difference between the soccer and riding values for part d).

Solution

1. Read the values: soccer, \(14\); swimming, \(7\); dancing, \(9\); riding, \(4\). 2. Soccer has the greatest value. 3. Add all four values: \(14 + 7 + 9 + 4 = 34\) students. 4. Add swimming and dancing: \(7 + 9 = 16\) students. 5. Find the difference between soccer and riding: \(14 - 4 = 10\) votes.

Answer

a) Soccer b) \(34\) students c) \(16\) students d) \(10\) additional votes
5350433
The heights of five trees in a city park were measured. The bar graph shows the heights in feet. a) Record the height of each tree. b) Which tree is \(15\,\text{ft}\) taller than the birch? c) Which two other trees have a combined height equal to the combined height of the fir and the birch? d) A gardener says, “The fir is \(20\,\text{ft}\) taller than the beech.” Is the gardener correct? Explain using values from the graph.
Figure for problem 535043

Hints

- Read each height using the scale, which increases by \(5\). - Compare the birch with each other tree for part b). - Add the fir and birch heights, then find another pair with the same sum. - Use subtraction to check the gardener's claim.

Solution

1. Read the heights: oak, \(35\,\text{ft}\); beech, \(25\,\text{ft}\); fir, \(45\,\text{ft}\); birch, \(15\,\text{ft}\); pine, \(30\,\text{ft}\). 2. The pine is \(30 - 15 = 15\,\text{ft}\) taller than the birch. 3. The fir and birch total \(45 + 15 = 60\,\text{ft}\). The oak and beech also total \(35 + 25 = 60\,\text{ft}\). 4. The fir is \(45 - 25 = 20\,\text{ft}\) taller than the beech, so the gardener is correct.

Answer

a) Oak: \(35\,\text{ft}\); beech: \(25\,\text{ft}\); fir: \(45\,\text{ft}\); birch: \(15\,\text{ft}\); pine: \(30\,\text{ft}\) b) The pine c) The oak and the beech d) Yes. \(45 - 25 = 20\,\text{ft}\).
5350463
A class measured the height of a sunflower each week. The bar graph shows the measurements. a) How tall was the sunflower in Week 4? b) How many centimeters did the sunflower grow from Week 2 to Week 3? c) Between which two consecutive weeks did the sunflower grow the most?
Figure for problem 535046

Hints

- Read each bar using the vertical-axis scale. - Growth between two weeks is the later height minus the earlier height. - Find each week-to-week increase and compare them.

Solution

1. The Week 4 bar shows \(75\,\text{cm}\). 2. From Week 2 to Week 3, the growth was \(55 - 30 = 25\,\text{cm}\). 3. The weekly increases were \(30 - 15 = 15\,\text{cm}\), \(55 - 30 = 25\,\text{cm}\), \(75 - 55 = 20\,\text{cm}\), and \(90 - 75 = 15\,\text{cm}\). The greatest increase was from Week 2 to Week 3.

Answer

a) \(75\,\text{cm}\) b) \(25\,\text{cm}\) c) From Week 2 to Week 3
5350513
At an elementary school, \(50\) students were asked about their favorite weekend activities. Each student could choose more than one activity, so the total number of responses is greater than the number of students. The bar graph shows the survey results. a) How many students chose each activity? Make a table of the values. b) Decide whether each statement is true or false. Give a brief reason. * More than half of the students chose playing sports. * Crafts was chosen by the fewest students. * Spending time with friends and reading received \(60\) responses altogether. * Listening to music received \(10\) fewer responses than playing sports.
Figure for problem 535051

Hints

- Read the vertical scale carefully. Each grid step represents \(5\) students. - For the first statement, compare the sports value with half of \(50\). - Use addition for the combined-response statement. - Use subtraction to check the “fewer” statement.

Solution

1. Read the values from the bar graph: playing sports, \(35\); spending time with friends, \(45\); reading, \(15\); listening to music, \(25\); crafts, \(10\). 2. Organize the values in a table: <table><tr><th>Activity</th><th>Number of students</th></tr><tr><td>Playing sports</td><td>\(35\)</td></tr><tr><td>Spending time with friends</td><td>\(45\)</td></tr><tr><td>Reading</td><td>\(15\)</td></tr><tr><td>Listening to music</td><td>\(25\)</td></tr><tr><td>Crafts</td><td>\(10\)</td></tr></table> 3. The first statement is true because half of \(50\) is \(25\), and \(35 > 25\). 4. The second statement is true because \(10\) is the smallest value. 5. The third statement is true because \(45 + 15 = 60\). 6. The fourth statement is true because \(35 - 25 = 10\).

Answer

a) <table><tr><th>Activity</th><th>Number of students</th></tr><tr><td>Playing sports</td><td>\(35\)</td></tr><tr><td>Spending time with friends</td><td>\(45\)</td></tr><tr><td>Reading</td><td>\(15\)</td></tr><tr><td>Listening to music</td><td>\(25\)</td></tr><tr><td>Crafts</td><td>\(10\)</td></tr></table> b) Statement 1 is true because \(35 > 25\). Statement 2 is true because \(10\) is the smallest value. Statement 3 is true because \(45 + 15 = 60\). Statement 4 is true because \(35 - 25 = 10\).
5350543
Four classes earned points at a school field day. The bar graph shows each class’s score. a) Which class earned the most points? b) Rank the classes from first place through fourth place. c) How many points did Classes A and C earn altogether?
Figure for problem 535054

Hints

- Read each bar using the scale, which increases by \(10\). - Order the scores from greatest to least for the ranking. - Add the Class A and Class C scores for part c).

Solution

1. Class B has the tallest bar, with \(150\) points. 2. Order the scores from greatest to least: \(150 > 120 > 110 > 90\). The ranking is Class B, Class A, Class D, Class C. 3. Add the scores for Classes A and C: \(120 + 90 = 210\) points.

Answer

a) Class B b) 1st: Class B; 2nd: Class A; 3rd: Class D; 4th: Class C c) \(210\) points
5351103
A weather simulation produced the number of rainy days shown for five fictional towns in April. a) How many rainy days did Maple Harbor have? b) Which town had the fewest rainy days? c) How many towns had more than \(10\) rainy days? d) How many rainy days did Pine Ridge and Stone Creek have altogether?
Figure for problem 535110

Hints

- The horizontal scale increases by \(1\), so each bar endpoint can be read directly. - Count only values greater than \(10\) for part c). - Add the Pine Ridge and Stone Creek values for part d).

Solution

1. Read the values: Pine Ridge, \(14\); Stone Creek, \(8\); Maple Harbor, \(12\); Lake Bend, \(11\); Sunny Glen, \(9\) days. 2. Maple Harbor had \(12\) rainy days. 3. Stone Creek has the least value, \(8\) days. 4. Pine Ridge, Maple Harbor, and Lake Bend each had more than \(10\) rainy days, so the count is \(3\) towns. 5. Pine Ridge and Stone Creek had \(14 + 8 = 22\) rainy days altogether.

Answer

a) \(12\) rainy days b) Stone Creek c) \(3\) towns d) \(22\) rainy days
5351273
Ms. Lee’s class held a beanbag toss contest. Each student had \(10\) tosses. The bar graph shows how many students got each number of hits. A missing bar means that \(0\) students got that number of hits. Students with at least \(7\) hits win a small prize. a) How many students got exactly \(5\) hits? b) How many students win a prize? c) How many students participated in the contest?
Figure for problem 535127

Hints

- The horizontal axis shows the number of hits, and the vertical axis shows the number of students. - For part a, find \(5\) on the horizontal axis and read the bar height. - For part b, add the frequencies for all hit counts of at least \(7\). - For part c, add the heights of all visible bars.

Solution

1. The bar above \(5\) has height \(8\), so \(8\) students got exactly \(5\) hits. 2. Students with at least \(7\) hits are represented by the bars at \(7\), \(8\), \(9\), and \(10\). The bars at \(9\) and \(10\) are missing, so they represent \(0\) students. There are \(3 + 1 + 0 + 0 = 4\) prize winners. 3. Add all bar heights: \(1 + 2 + 4 + 6 + 8 + 5 + 3 + 1 = 30\). Therefore, \(30\) students participated.

Answer

a) \(8\) students b) \(4\) students c) \(30\) students
5351323
A school library recorded how many books were checked out from five categories last month. The horizontal bar graph shows the results. 1. Which category had the most checkouts? 2. How many adventure books were checked out? 3. What is the difference between the number of comics and the number of nonfiction books checked out? 4. How many books were checked out from all five categories altogether?
Figure for problem 535132

Hints

- Read each bar using the horizontal scale, which increases by \(5\). - Subtract to find the difference in question 3. - Add all five values for the total.

Solution

1. Mystery has the longest bar, with \(120\) checkouts. 2. The adventure bar shows \(85\) books. 3. Subtract the nonfiction value from the comics value: \(110 - 60 = 50\) books. 4. Add all five values: \(120 + 110 + 85 + 60 + 45 = 420\) books.

Answer

1. Mystery 2. \(85\) books 3. \(50\) books 4. \(420\) books
5381233
Teams collect nature cards during a forest scavenger hunt. How many more cards does Team Fox need, at minimum, to have more cards than Team Badger?
Figure for problem 538123

Hints

- Read the values for Team Fox and Team Badger. - Decide the smallest total that is greater than Team Badger's total. - Subtract Team Fox's current total from that target.

Solution

1. Team Fox has \(15\) cards, and Team Badger has \(20\) cards. 2. To have more than \(20\), Team Fox needs at least \(21\) cards. 3. The number still needed is \(21 - 15 = 6\) cards.

Answer

Team Fox needs at least \(6\) more cards.
5381253
A zoo counts visitors at four entrances. Which two entrances have exactly \(40\) visitors altogether?
Figure for problem 538125

Hints

- Write down the four values from the graph. - Test pairs in an organized way. - Check that you found every possible pair.

Solution

1. Read the four values: North: \(15\), South: \(35\), East: \(25\), and West: \(10\). 2. Test pairs. North and East give \(15 + 25 = 40\). 3. No other pair has a total of \(40\).

Answer

The North and East entrances have exactly \(40\) visitors altogether.
5381263
Jonah says, “More loaves of bread were sold on Wednesday than on Tuesday.” Check his statement and correct it.
Figure for problem 538126

Hints

- Read the Tuesday and Wednesday values. - Pay attention to the word “more.” - Subtract to state the corrected comparison exactly.

Solution

1. The graph shows \(15\) loaves on Wednesday and \(18\) loaves on Tuesday. 2. Since \(15 < 18\), Jonah's statement is false. 3. The difference is \(18 - 15 = 3\).

Answer

The statement is false. On Wednesday, \(3\) fewer loaves were sold than on Tuesday.
5381273
Which two statements match the graph? A: Dogs and rabbits received the same number of votes. B: Horses received the most votes. C: Cats received \(4\) more votes than dogs. D: There were fewer than \(40\) votes altogether.
Figure for problem 538127

Hints

- Check each statement separately against the graph. - Pay attention to words such as “same,” “more,” and “most.” - For the total, add all four bar values.

Solution

1. Dogs and rabbits each received \(12\) votes, so A is true. 2. Cats received \(16 - 12 = 4\) more votes than dogs, so C is true. 3. B is false because cats received the most votes. 4. D is false because \(12 + 16 + 8 + 12 = 48\), which is not fewer than \(40\).

Answer

Statements A and C are true.
5381293
During a field game, Team Green later receives \(6\) more points. Which team is then in the lead, and with how many points?
Figure for problem 538129

Hints

- Update Team Green's score first. - Keep the other teams' scores unchanged. - Compare all four scores after the change.

Solution

1. Team Green's score changes from \(30\) to \(30 + 6 = 36\). 2. Compare \(36\) with the other scores: \(25\), \(35\), and \(20\). 3. Since \(36\) is greatest, Team Green is in the lead.

Answer

Team Green is in the lead with \(36\) points.
5381303
Because of an error in a quiz, Team Star loses \(8\) points. What place is Team Star in after the deduction?
Figure for problem 538130

Hints

- Change only Team Star's score. - Compare the new score with all three other scores. - Order the four scores from greatest to least.

Solution

1. Team Star's new score is \(40 - 8 = 32\) points. 2. The other teams have \(35\), \(40\), and \(45\) points. 3. Since \(32\) is the least score, Team Star is in fourth place.

Answer

Team Star is in fourth place.
5381323
The graph shows how students travel to a sports field. Do more or fewer students travel by bike and on foot together than by car? How many more or fewer?
Figure for problem 538132

Hints

- Add the bike and walking bars first. - Compare that sum with the car bar. - Subtract to find how much greater or smaller it is.

Solution

1. By bike and on foot together, \(12 + 8 = 20\) students travel to the field. 2. By car, \(16\) students travel to the field. 3. The difference is \(20 - 16 = 4\), so the bike-and-walking total is greater.

Answer

\(4\) more students travel by bike and on foot together than by car.
5381333
Six teams collect bags of recyclables. Which teams collected at least \(10\) bags but no more than \(15\) bags?
Figure for problem 538133

Hints

- Read each team's value from the graph. - “At least \(10\)” includes \(10\). - “No more than \(15\)” includes \(15\).

Solution

1. The values from \(10\) through \(15\), including both endpoints, are \(10\), \(15\), and \(15\). 2. Those values belong to Teams B, C, and F.

Answer

Teams B, C, and F.
5381353
A mystery drink received more votes than cocoa but fewer votes than iced tea. Which drink is it?
Figure for problem 538135

Hints

- Read the cocoa and iced-tea values first. - Look for a value greater than \(15\) but less than \(25\). - Check that only one drink fits both conditions.

Solution

1. Cocoa received \(15\) votes, and iced tea received \(25\) votes. 2. Juice is the only drink between them, with \(20\) votes.

Answer

The mystery drink is juice.
5381363
The graph shows soft pretzels baked during one week. How many pretzels were baked on all days except Wednesday?
Figure for problem 538136

Hints

- Leave out the Wednesday bar. - Add the other four bar values. - Pair numbers to make the addition easier.

Solution

1. The values for Monday, Tuesday, Thursday, and Friday are \(15\), \(20\), \(25\), and \(30\). 2. Add them: \(15 + 20 + 25 + 30 = 90\).

Answer

\(90\) pretzels were baked on all days except Wednesday.
5381373
Four groups estimate the number of steps along a short path. Which group's estimate is closest to \(55\) steps?
Figure for problem 538137

Hints

- Find how far each estimate is from \(55\). - Use a positive difference whether the estimate is above or below \(55\). - Choose the least difference.

Solution

1. Find how far each estimate is from \(55\). 2. Group A: \(55 - 40 = 15\); Group B: \(55 - 50 = 5\); Group C: \(55 - 30 = 25\); Group D: \(70 - 55 = 15\). 3. The least difference is \(5\), for Group B.

Answer

Group B is closest to \(55\) steps.
5381383
Lina and Mina want to have at least \(45\) stickers altogether. How many more stickers do they need?
Figure for problem 538138

Hints

- Add Lina's and Mina's amounts first. - Compare their total with \(45\). - Subtract to find how many are still needed.

Solution

1. Lina and Mina have \(20 + 15 = 35\) stickers altogether. 2. The number still needed is \(45 - 35 = 10\) stickers.

Answer

They need \(10\) more stickers.
5381403
Mara reads Bar C as \(9\). Explain her error and give the correct value.
Figure for problem 538140

Hints

- First determine how much each tick interval represents. - Match the top of Bar C to a scale value. - Check your reading by counting in fives.

Solution

1. The scale increases by \(5\) at each tick mark, not by \(1\). 2. Bar C ends at the ninth interval above \(0\), so its value is \(9 \times 5 = 45\).

Answer

Mara counted tick intervals instead of scale values. The correct value is \(45\).
5381423
A class used \(60\) paper strips for a craft. The graph shows the three colors. How many strips were purple? Confirm the value using the other two bars.
Figure for problem 538142

Hints

- Add the orange and green values. - Subtract their sum from the total of \(60\). - Compare your result with the purple bar.

Solution

1. The orange and green strips total \(20 + 15 = 35\). 2. The remaining number is \(60 - 35 = 25\). 3. This matches the purple bar, which has a value of \(25\).

Answer

There were \(25\) purple paper strips.
5381433
Are the two shortest bars together greater or less than the tallest bar? By how much?
Figure for problem 538143

Hints

- Identify the two shortest bars and add their values. - Identify the tallest bar. - Compare the sum with the tallest bar by subtraction.

Solution

1. The two least values are \(10\) and \(15\), with a sum of \(10 + 15 = 25\). 2. The greatest value is \(30\). 3. Since \(30 - 25 = 5\), the sum of the two least values is less by \(5\).

Answer

The two shortest bars together are \(5\) less than the tallest bar.
5381443
Teams collect keys during a puzzle challenge. Which team is in second place, and how far behind first place is it?
Figure for problem 538144

Hints

- Find the greatest and second-greatest bar values. - The second-greatest value is second place. - Subtract the two values to find the gap.

Solution

1. The two greatest values are Team Dune with \(40\) keys and Team Meadow with \(35\) keys. 2. Team Meadow is in second place. 3. The gap is \(40 - 35 = 5\) keys.

Answer

Team Meadow is in second place, \(5\) keys behind Team Dune.
5381473
For a nature collage, the number of stones is doubled. The numbers of wood pieces and leaves stay the same. How many pieces will the collage have altogether?
Figure for problem 538147

Hints

- Double only the stone value. - Keep the wood and leaf values unchanged. - Add the three new values.

Solution

1. The number of stones changes from \(10\) to \(2 \times 10 = 20\). 2. The new total is \(15 + 20 + 20 = 55\) pieces.

Answer

The collage will have \(55\) pieces altogether.
5381483
Some birds leave the largest flock. How many birds must leave so that this flock has the same number of birds as the second-largest flock?
Figure for problem 538148

Hints

- Identify the largest and second-largest flocks. - Find the difference between their sizes. - Check that removing that number makes the flock sizes equal.

Solution

1. The largest flock is the cranes with \(40\) birds. The second-largest flock is the geese with \(35\) birds. 2. The difference is \(40 - 35 = 5\) birds.

Answer

\(5\) cranes must leave the flock.
5381523
Four collection boxes contain the amounts shown in the graph. More items will be added to Box S4 so that the boxes contain \(70\) items altogether. How many items must be added?
Figure for problem 538152

Hints

- Add the amounts in all four boxes first. - Compare that total with \(70\). - Subtract to find how many items must be added.

Solution

1. The current total is \(10 + 15 + 20 + 20 = 65\) items. 2. The number needed is \(70 - 65 = 5\) items.

Answer

\(5\) items must be added to Box S4.
5381543
Each group should have at least \(20\) points. How many points must be distributed altogether if points are added only to groups below \(20\)?
Figure for problem 538154

Hints

- Find how many points each group below \(20\) needs. - Do not add points to groups already at or above \(20\). - Add the needed amounts.

Solution

1. Group A needs \(20 - 15 = 5\) points. 2. Group C needs \(20 - 10 = 10\) points. 3. Groups B and D already meet the goal. 4. Altogether, \(5 + 10 = 15\) points must be distributed.

Answer

\(15\) points must be distributed altogether.
5381563
The graph shows red and blue beads. Check both claims: “There are \(40\) beads altogether” and “There are \(8\) more red beads than blue beads.” Do both claims match the graph?
Figure for problem 538156

Hints

- Check the total claim by addition. - Check the comparison claim by subtraction. - Decide whether each claim is true.

Solution

1. The total is \(24 + 16 = 40\), so the first claim is true. 2. The difference is \(24 - 16 = 8\), so the second claim is true. 3. Both claims match the graph.

Answer

Yes. Both claims match the graph.
5381573
Group A gives \(5\) cards to Group B. Which groups then have the same number of cards?
Figure for problem 538157

Hints

- Subtract \(5\) from Group A and add \(5\) to Group B. - Keep Group C's value unchanged. - Compare the three new values.

Solution

1. Group A will have \(30 - 5 = 25\) cards. 2. Group B will have \(20 + 5 = 25\) cards. 3. Group C already has \(25\) cards.

Answer

All three groups will have \(25\) cards each.
5381583
A mystery tree has a bar taller than the spruce bar but shorter than the pine bar. It is also not the shortest bar. Which tree is it?
Figure for problem 538158

Hints

- Read the spruce and pine values from the scale. - Find the bar whose value lies strictly between those two values. - Check the final condition against the shortest bar.

Solution

1. The spruce has a value of \(15\), and the pine has a value of \(25\). 2. The only bar with a value between \(15\) and \(25\) is the fir at \(20\). 3. The fir is not the shortest bar, so it satisfies every condition.

Answer

The mystery tree is the fir.
5381623
A bakery packages rolls on four days. How many rolls does the graph show altogether?
Figure for problem 538162

Hints

- Read all four bar values. - Add the values in convenient pairs. - Check that the total is reasonable compared with the bars.

Solution

1. The four values are \(120\), \(200\), \(160\), and \(160\). 2. Add them: \(120 + 200 + 160 + 160 = 640\).

Answer

The graph shows \(640\) rolls altogether.
5381633
Nuri describes Bar D this way: “It is \(3\) greater than C and \(3\) less than B.” Is the description correct?
Figure for problem 538163

Hints

- Check each part of the description separately. - Find the difference between D and C. - Find the difference between B and D.

Solution

1. Bar C has a value of \(18\), Bar D has \(21\), and Bar B has \(24\). 2. Since \(21 - 18 = 3\) and \(24 - 21 = 3\), both parts of the description are correct.

Answer

Yes. Nuri's description is correct.
5381653
Which bar is as tall as two other bars combined?
Figure for problem 538165

Hints

- Write down all four values. - Add possible pairs. - Look for a single bar with the same value as a pair sum.

Solution

1. Bars A and B have a combined value of \(5 + 15 = 20\). 2. Bar C also has a value of \(20\).

Answer

Bar C is as tall as Bars A and B combined.
5381673
Leah says, “Exactly \(200\) raffle tickets were sold at the three booths altogether.” Is she correct?
Figure for problem 538167

Hints

- Read all three bar values. - Add the values. - Compare the sum with \(200\).

Solution

1. The bars show \(70\), \(50\), and \(90\) tickets. 2. Their sum is \(70 + 50 + 90 = 210\). 3. Since \(210 \ne 200\), Leah is not correct.

Answer

No. The three booths sold \(210\) raffle tickets altogether.
5381683
The day with the greatest value is removed from the data. What is the sum of the other three days?
Figure for problem 538168

Hints

- Identify and leave out the greatest bar. - Add the other three values. - Check that you used exactly three days.

Solution

1. Tuesday has the greatest value, \(25\). 2. The remaining values are \(15\), \(10\), and \(20\). 3. Their sum is \(15 + 10 + 20 = 45\).

Answer

The remaining three days have a sum of \(45\).
5381693
Which individual bars are taller than Bars A and B combined?
Figure for problem 538169

Hints

- Add the values of A and B. - Compare each other bar with that sum. - Remember that equal to is not the same as greater than.

Solution

1. Bars A and B have a combined value of \(10 + 15 = 25\). 2. Bar C has a value of \(20\), and Bar D has a value of \(25\). 3. Neither value is greater than \(25\).

Answer

No individual bar is taller than Bars A and B combined.
5381713
Compare Bars A and B combined with Bars C and D combined. Which pair has the greater total, and by how much?
Figure for problem 538171

Hints

- Find each pair total separately. - Compare the two totals. - Subtract to find the difference.

Solution

1. Bars A and B total \(10 + 20 = 30\). 2. Bars C and D total \(25 + 10 = 35\). 3. The difference is \(35 - 30 = 5\).

Answer

Bars C and D have the greater total, by \(5\).
5381733
Graph a) shows the points in Round \(1\), and Graph b) shows the points in Round \(2\). Which group increased its score the most?
Figure for problem 538173

Hints

- Compare the same group in both graphs. - Find each change from a) to b). - Choose the greatest positive change.

Solution

1. Group A increased by \(15 - 10 = 5\) points. 2. Group B changed by \(20 - 20 = 0\) points. 3. Group C increased by \(25 - 15 = 10\) points. 4. Group D decreased by \(25 - 20 = 5\) points. The greatest increase is \(10\), for Group C.

Answer

Group C increased its score the most, by \(10\) points.
5381743
The graphs show visitor counts in two different weeks. On which weekday did the number decrease the most from a) to b)?
Figure for problem 538174

Hints

- Compare the same weekday in both graphs. - Find each decrease from a) to b). - Choose the greatest decrease.

Solution

1. The decreases are Monday: \(30 - 25 = 5\), Tuesday: \(35 - 20 = 15\), Wednesday: \(25 - 25 = 0\), and Thursday: \(30 - 20 = 10\). 2. The greatest decrease is \(15\), on Tuesday.

Answer

The number decreased the most on Tuesday, by \(15\) visitors.
5381763
Graph a) shows bags of recyclables collected by three teams in Week \(1\), and Graph b) shows the bags collected by the same teams in Week \(2\). In which week were more bags collected altogether, and how many more?
Figure for problem 538176

Hints

- Find the total for each graph separately. - Compare the two totals. - Subtract to find how many more.

Solution

1. Week \(1\) total: \(15 + 25 + 20 = 60\) bags. 2. Week \(2\) total: \(20 + 15 + 30 = 65\) bags. 3. The difference is \(65 - 60 = 5\) bags.

Answer

Week \(2\) had \(5\) more bags collected.
5381773
Do the two graphs have the same total? Justify your answer using the values shown.
Figure for problem 538177

Hints

- Add all four values in Graph a). - Add all four values in Graph b). - Compare the totals.

Solution

1. Graph a) has a total of \(10 + 20 + 15 + 25 = 70\). 2. Graph b) has a total of \(15 + 10 + 25 + 20 = 70\). 3. The totals are equal.

Answer

Yes. Both graphs have a total of \(70\).
5381783
Compare Graphs a) and b). 1) Which regions increased? 2) Which regions decreased?
Figure for problem 538178

Hints

- Compare the same region in both graphs. - Mark each change as an increase or a decrease. - Check all four regions.

Solution

1. South increased from \(25\) to \(30\), and West increased from \(20\) to \(25\). 2. North decreased from \(30\) to \(25\), and East decreased from \(35\) to \(30\).

Answer

1) South and West increased. 2) North and East decreased.
5381803
How does the gap between A and B change from Graph a) to Graph b)?
Figure for problem 538180

Hints

- Find the A–B gap in each graph. - Compare the two gaps. - State whether the gap became larger or smaller.

Solution

1. In a), the gap is \(40 - 30 = 10\) points. 2. In b), the gap is \(45 - 40 = 5\) points. 3. The gap becomes \(10 - 5 = 5\) points smaller.

Answer

The gap becomes \(5\) points smaller.
5381813
Compare both graphs. 1) In Graph a), do more, fewer, or the same number of students travel by bike and on foot together than by bus? 2) In Graph b), do more, fewer, or the same number of students travel by bike and on foot together than by bus?
Figure for problem 538181

Hints

- Add the bike and walking values in each graph. - Compare each sum with the bus value in the same graph. - State the result for both a) and b).

Solution

1. In a), bike and walking total \(15 + 10 = 25\), the same as the bus value of \(25\). 2. In b), bike and walking total \(20 + 15 = 35\), while the bus value is \(20\). 3. In b), the combined total is \(35 - 20 = 15\) greater.

Answer

1) In Graph a), the numbers are equal. 2) In Graph b), \(15\) more students travel by bike and on foot together than by bus.
5381833
The total increases from a) to b). Which product contributes the most to this increase?
Figure for problem 538183

Hints

- Compare each product in the two graphs. - Find each increase or decrease. - Choose the greatest positive change.

Solution

1. Apple crates increase by \(25 - 20 = 5\). 2. Pear crates increase by \(25 - 15 = 10\). 3. Nut crates decrease by \(25 - 20 = 5\). 4. The greatest increase is \(10\), for pears.

Answer

Pears contribute the most, with an increase of \(10\) crates.
5381853
For each group, add its value from a) to its value from b). Which groups have the same sum?
Figure for problem 538185

Hints

- Add the two values for one group at a time. - Record all four sums. - Compare the sums.

Solution

1. Group A: \(5 + 20 = 25\). 2. Group B: \(10 + 15 = 25\). 3. Group C: \(15 + 10 = 25\). 4. Group D: \(20 + 5 = 25\). All four sums are equal.

Answer

All four groups have the same sum: \(25\) each.
5381863
In which graph are the greatest and least values farther apart?
Figure for problem 538186

Hints

- Find the greatest and least value in each graph. - Subtract to find each difference. - Compare the two differences.

Solution

1. In a), the difference between the greatest and least values is \(25 - 10 = 15\). 2. In b), the difference between the greatest and least values is \(20 - 15 = 5\). 3. Since \(15 > 5\), the values are farther apart in a).

Answer

The greatest and least values are farther apart in Graph a).
5381883
Compare the order of the bar heights in Graphs a) and b). 1) How does the order change? 2) Which bar keeps the same value, and what is that value?
Figure for problem 538188

Hints

- Order the three bars in each graph from least to greatest. - Compare the two orders. - Check whether any bar keeps the same value.

Solution

1. In a), \(A < B < C\). 2. In b), \(A > B > C\). 3. The order is reversed, and B stays at \(20\) in both graphs.

Answer

1) The order is reversed. 2) Bar B stays at \(20\).
5381893
How many objects do the two graphs show altogether?
Figure for problem 538189

Hints

- Find the total in each graph first. - Add the two graph totals. - Check that all six bars were included.

Solution

1. Graph a) has \(15 + 20 + 10 = 45\) objects. 2. Graph b) has \(20 + 15 + 15 = 50\) objects. 3. Together, the graphs show \(45 + 50 = 95\) objects.

Answer

The two graphs show \(95\) objects altogether.
5381903
Which group is below \(20\) in a) but reaches at least \(20\) in b)?
Figure for problem 538190

Hints

- Check the value in a) first. - Then check the same group in b). - Apply both conditions to every group.

Solution

1. Group A increases from \(15\) to \(20\), so it meets both conditions. 2. Group C remains below \(20\). 3. Groups B and D were already above \(20\) in a).

Answer

Only Group A meets both conditions.
5381913
Which group has the greatest combined total from the two graphs?
Figure for problem 538191

Hints

- Add each group's two values. - Record the four totals. - Choose the greatest total.

Solution

1. Group A: \(10 + 20 = 30\). 2. Group B: \(15 + 10 = 25\). 3. Group C: \(20 + 15 = 35\). 4. Group D: \(25 + 20 = 45\). The greatest total is \(45\).

Answer

Group D has the greatest combined total, \(45\).
5381923
In Graph b), only Bar C will be increased until the two graphs have the same total. By how much must C increase?
Figure for problem 538192

Hints

- Find the total of each graph. - Find the difference between the totals. - Only Bar C changes.

Solution

1. Graph a) has a total of \(20 + 15 + 25 = 60\). 2. Graph b) has a total of \(15 + 20 + 20 = 55\). 3. The difference is \(60 - 55 = 5\), so C must increase by \(5\).

Answer

Bar C in b) must increase by \(5\).
5382153
Acorns collected: <table><tr><th>Student</th><th>Number of acorns</th></tr><tr><td>Mia</td><td>\(24\)</td></tr><tr><td>Owen</td><td>\(18\)</td></tr><tr><td>Maya</td><td>\(31\)</td></tr><tr><td>Ben</td><td>\(27\)</td></tr></table> On a bar graph, each gridline represents \(5\) acorns. Which bars will end between two gridlines? Also list all four bar lengths.

Hints

- First describe how the data values would appear on the graph. - Then check each value against the multiples of \(5\).

Solution

1. Match each student to the value in the table. 2. The bar lengths are Mia, \(24\); Owen, \(18\); Maya, \(31\); Ben, \(27\). 3. Gridlines occur at multiples of \(5\). None of the four values is a multiple of \(5\), so all four bars end between gridlines.

Answer

Mia: \(24\), Owen: \(18\), Maya: \(31\), Ben: \(27\). All four bars end between gridlines.
5382163
Visitors to a small wildlife park: <table><tr><th>Day</th><th>Visitors</th></tr><tr><td>Sat</td><td>\(120\)</td></tr><tr><td>Sun</td><td>\(160\)</td></tr><tr><td>Mon</td><td>\(80\)</td></tr><tr><td>Tue</td><td>\(100\)</td></tr></table> Choose the **largest** interval among \(10\), \(20\), and \(50\) visitors per gridline that places every bar endpoint exactly on a gridline. Briefly justify your choice.

Hints

- Test each listed interval against all four values. - Eliminate any interval that would put even one bar endpoint between gridlines. - Among the intervals that work, choose the largest one.

Solution

1. Intervals of \(10\) work because all four values land on gridlines. 2. Intervals of \(20\) also work: \(80, 100, 120, 160\) all land on gridlines. 3. Intervals of \(50\) do not work because, for example, \(120\) lies between two \(50\)-visitor gridlines. 4. Of the working choices, \(20\) is the largest interval.

Answer

Use \(20\) visitors per gridline. It is the largest listed interval that places every value on a gridline.
5382203
Steps taken on a nature trail: <table><tr><th>Trail section</th><th>Steps</th></tr><tr><td>A</td><td>\(250\)</td></tr><tr><td>B</td><td>\(400\)</td></tr><tr><td>C</td><td>\(300\)</td></tr><tr><td>D</td><td>\(550\)</td></tr><tr><td>E</td><td>\(450\)</td></tr></table> The vertical axis of a bar graph may have at most \(6\) equal intervals from \(0\) to its maximum. Choose an appropriate interval size and maximum.

Hints

- Determine what one equal interval on the vertical axis represents. - Make sure the scale is evenly spaced and reaches above the greatest data value.

Solution

1. The maximum must be at least \(550\). 2. Using intervals of \(100\) gives the labeled values \(0, 100, 200, 300, 400, 500, 600\). 3. This scale has \(6\) equal intervals and includes every data value, so an interval size of \(100\) and a maximum of \(600\) work.

Answer

Use intervals of \(100\) and a maximum of \(600\).
5382263
A simplified butterfly count will be shown with bar heights of \(14, 21, 35, 42\). Which interval size—\(2\), \(7\), or \(10\)—places every bar endpoint exactly on a gridline? How many intervals are needed to reach \(42\)?

Hints

- Think about what one equal interval on the vertical axis represents. - Check whether every data value is a multiple of the interval size.

Solution

1. The value \(21\) is not a multiple of \(2\), so intervals of \(2\) do not work for every bar. 2. Several values are not multiples of \(10\), so intervals of \(10\) do not work. 3. All four values are multiples of \(7\). Since \(42 \div 7 = 6\), the scale needs \(6\) intervals to reach \(42\).

Answer

Use intervals of \(7\). The scale needs \(6\) intervals to reach \(42\).
5382313
A reading-club bar graph will show \(35, 50, 65, 80\) minutes. Test interval sizes of \(5\), \(10\), and \(15\). Which is the only interval size that places all four values exactly on gridlines? Give one counterexample for each other interval size.

Hints

- Read every value and every possible interval size carefully. - Test each value against each interval size instead of checking only one bar.

Solution

1. All four values are multiples of \(5\), so intervals of \(5\) work. 2. The value \(35\) is not a multiple of \(10\), so intervals of \(10\) do not work. 3. The value \(50\) is not a multiple of \(15\), so intervals of \(15\) do not work.

Answer

Only intervals of \(5\) work for all four values. Counterexamples are \(35\) for intervals of \(10\) and \(50\) for intervals of \(15\).
5382343
Two bar graphs show the values \(25, 50, 75, 100\). Graph A uses intervals of \(25\), and Graph B uses intervals of \(5\). Both axes begin at \(0\) and end at \(100\). Are both graphs correct? How many intervals does each axis have, and which graph uses fewer intervals?

Hints

- Check whether both scales can show each data value exactly. - Count equal jumps from \(0\) to \(100\) on each scale. - Compare the two interval counts.

Solution

1. Both interval sizes place every data value on a gridline, so both graphs can show the data correctly. 2. Counting by \(25\) from \(0\) to \(100\) gives \(4\) intervals. 3. Counting by \(5\) from \(0\) to \(100\) gives \(20\) intervals. 4. Graph A uses fewer intervals.

Answer

Both graphs are correct. Graph A has \(4\) intervals, Graph B has \(20\) intervals, and Graph A uses fewer intervals.
5382383
The table shows the number of four types of trees. <table><tr><th>Tree type</th><th>Number</th></tr><tr><td>Oak</td><td>\(18\)</td></tr><tr><td>Maple</td><td>\(12\)</td></tr><tr><td>Birch</td><td>\(15\)</td></tr><tr><td>Linden</td><td>\(9\)</td></tr></table> All bar heights in the graph are correct, but two category labels have been switched. Which labels are they?
Figure for problem 538238

Hints

- Compare each bar height with the corresponding value in the table. - First match every height to the correct tree type, and then check the displayed labels.

Solution

1. The second bar has height \(12\), so it should be labeled Maple, but it is labeled Birch. 2. The third bar has height \(15\), so it should be labeled Birch, but it is labeled Maple. 3. Therefore, the Maple and Birch labels must be switched.

Answer

The labels Maple and Birch must be switched.
5382423
Boxes in a storage room: <table><tr><th>Color</th><th>Correct number</th></tr><tr><td>Red</td><td>\(24\)</td></tr><tr><td>Blue</td><td>\(16\)</td></tr><tr><td>Green</td><td>\(28\)</td></tr><tr><td>Yellow</td><td>\(20\)</td></tr></table> One horizontal bar has the wrong length. Name its color, the value shown, and its correct length.
Figure for problem 538242

Hints

- Compare each bar with both the scale and the table. - Check every category before deciding which bar is incorrect.

Solution

1. Compare each bar value with the matching table value. 2. Only the Green bar does not match. 3. The Green bar shows \(32\), but the table gives \(28\). Its correct length is \(28\).

Answer

The Green bar is too long. It shows \(32\) instead of \(28\), so its correct length is \(28\).
5382503
After the point shown in the graph, Mia runs \(4\) more laps, and Tom loses \(3\) laps because of a counting error. Which two bars change, and what are all four new bar heights?
Figure for problem 538250

Hints

- First read all four starting heights from the graph. - Change only Mia’s and Tom’s values, and then report all four heights.

Solution

1. Mia’s new value is \(12 + 4 = 16\). 2. Tom’s corrected value is \(15 - 3 = 12\). 3. Eli and Zoe stay at \(10\) and \(14\), respectively.

Answer

Mia: \(16\), Tom: \(12\), Eli: \(10\), Zoe: \(14\).
5382523
A food-drive graph shows bags collected in the North, South, East, and West neighborhoods. For a new summary, the South and East categories will be combined into Southeast. Which three bars should the new graph have, and what should their heights be?
Figure for problem 538252

Hints

- Identify which two categories must be combined. - Keep the values of all categories that are not being combined.

Solution

1. Combine the South and East values: \(30 + 20 = 50\) bags for Southeast. 2. The North and West values stay at \(25\) and \(35\), respectively.

Answer

North: \(25\), Southeast: \(50\), West: \(35\).
5382573
In the graph, the Yogurt category gains \(8\) orders and the Fruit category loses \(4\) orders. Give all four new bar heights. Which two bars are then equal in height?
Figure for problem 538257

Hints

- Read each starting value from the graph. - Change only the two named categories, and then compare all four new values.

Solution

1. Yogurt changes from \(20\) to \(20 + 8 = 28\). 2. Fruit changes from \(24\) to \(24 - 4 = 20\). 3. Pretzels stays at \(32\), and Juice stays at \(28\). Therefore, Juice and Yogurt have equal heights.

Answer

Pretzels: \(32\), Juice: \(28\), Fruit: \(20\), Yogurt: \(28\). Juice and Yogurt are equal in height.
5382693
There are \(24\) balls in a gym altogether. Each candidate graph shows the same soccer and basketball counts but a different volleyball count. Which graph shows the correct volleyball bar?
Figure for problem 538269

Hints

- Read the soccer and basketball values from one of the candidate graphs. - Subtract those two known categories from the total of \(24\). - Choose the graph whose volleyball bar matches the remaining number.

Solution

1. Read the fixed bars from the candidate graphs: soccer, \(11\); basketball, \(5\). 2. Find the missing number of volleyballs: \(24 - 11 - 5 = 8\). 3. Only graph a) shows a volleyball value of \(8\).

Answer

Graph a) is correct; the volleyball value is \(8\).
5382713
The bars show how many coins of each type are in a jar. The horizontal axis is labeled “Value in cents.” Why is that label incorrect, and what should the label be?
Figure for problem 538271

Hints

- Decide whether each bar represents a count or a monetary value. - Match the axis label to the quantity actually measured.

Solution

1. The bar values \(25\), \(18\), and \(9\) are counts of coins. 2. The total value in cents would require a separate calculation using each coin’s value. 3. Therefore, the axis should be labeled “Number of coins.”

Answer

The correct label is “Number of coins,” not “Value in cents.”
5382943
Art studio: <table><tr><th>Main material</th><th>Number of artworks</th></tr><tr><td>Clay</td><td>\(13\)</td></tr><tr><td>Wood</td><td>\(19\)</td></tr><tr><td>Fabric</td><td>\(11\)</td></tr><tr><td>Paper</td><td>\(17\)</td></tr></table> For the final bar graph, \(4\) artworks are moved from the Wood category to the Paper category. What are the new bar lengths?

Hints

- One category loses \(4\) artworks and another category gains \(4\). - Check that the total number of artworks stays the same.

Solution

1. For Wood, subtract \(4\): \(19 - 4 = 15\). 2. For Paper, add \(4\): \(17 + 4 = 21\). 3. The Clay and Fabric values stay the same.

Answer

Clay: \(13\) Wood: \(15\) Fabric: \(11\) Paper: \(21\)
5383053
The bar graph shows bicycle counts for North, South, and West. The East bar has not been drawn. Altogether, the four directions account for \(80\) bicycles. Read the three shown bar heights and determine the height of the missing East bar.
Figure for problem 538305

Hints

- Read each shown bar height from the vertical scale before doing any arithmetic. - Add the three displayed counts. - Compare their sum with the stated total of \(80\).

Solution

1. Read the graph: North is \(18\), South is \(24\), and West is \(16\). 2. Add the shown bars: \(18 + 24 + 16 = 58\). 3. Subtract from the total: \(80 - 58 = 22\).

Answer

The East bar must have height \(22\).
5383073
Choose a clear graph for these data: <table><tr><th>Place</th><th>Visits</th></tr><tr><td>City Park Swimming Pool</td><td>\(28\)</td></tr><tr><td>Museum of Natural History</td><td>\(35\)</td></tr><tr><td>Downtown Public Library</td><td>\(22\)</td></tr><tr><td>Northside Climbing Gym</td><td>\(31\)</td></tr></table> Choose a horizontal or vertical bar graph. Explain your choice and give the four bar lengths or heights.

Hints

- Consider the length of the category labels. - Check that every data value is represented by the correct bar length.

Solution

1. The category names are long. 2. A horizontal bar graph provides more room for long labels. 3. In table order, the bar lengths are \(28, 35, 22, 31\).

Answer

Use a horizontal bar graph because the category labels are long. The bar lengths are \(28, 35, 22, 31\).
5383103
Three bars represent categories A, B, and C. Bar A has length \(26\). Bar B is \(9\) longer than A, and bar C is \(4\) shorter than A. Give all three bar lengths and a suitable vertical-axis maximum using intervals of \(5\).

Hints

- Use the comparisons with A to find B and C. - Choose a scale maximum that is a multiple of \(5\) and at least as great as every bar length.

Solution

1. Find B: \(26 + 9 = 35\). 2. Find C: \(26 - 4 = 22\). 3. The greatest value is \(35\). With intervals of \(5\), a suitable maximum above it is \(40\).

Answer

A: \(26\), B: \(35\), C: \(22\); use an axis maximum of \(40\).
5383123
The two graphs show the same data. Are both representations mathematically correct? Explain how their scales differ and which graph you would choose for a quick overview.
Figure for problem 538312

Hints

- Compare both the bar values and the axis scales. - Base your choice on readability, not on whether one graph is mathematically correct.

Solution

1. In both graphs, categories A, B, C, and D have values \(20, 30, 10, 40\). 2. Graph a) uses intervals of \(10\) and extends to \(50\). Graph b) uses intervals of \(5\) and extends to \(40\). 3. Both graphs are correct. Graph a) is a reasonable choice for a quick overview because it has fewer gridlines, though graph b) is also acceptable with a clear justification.

Answer

Both graphs are correct. Graph a) has a coarser scale, and graph b) has a finer scale. A justified choice of either graph is acceptable; graph a) is quicker to scan because it has fewer gridlines.
5402613
The bar graph shows the number of votes for three class read-aloud choices. a) How many votes were cast altogether? b) How many more votes did Humor receive than Mystery?
Figure for problem 540261

Hints

- Use the vertical scale to read each bar exactly. - For the total, combine all three category values. - For “how many more,” subtract the Mystery value from the Humor value.

Solution

1. Read the bars: Mystery has \(8\) votes, Adventure has \(16\) votes, and Humor has \(24\) votes. 2. For part a), add the votes: \(8 + 16 + 24 = 48\). 3. For part b), subtract: \(24 - 8 = 16\).

Answer

a) \(48\) votes b) \(16\) more votes
5548563
A supply shelf has \(5\) pencils, \(0\) erasers, \(10\) rulers, and \(15\) markers. The bar-graph scale increases by \(5\). Which candidate graph represents all four categories correctly?
Figure for problem 554856

Hints

- Match the categories in order before comparing heights. - A zero category should still be labeled but should have no bar above the baseline. - Use the scale of \(5\) to check each nonzero endpoint.

Solution

1. A correct graph needs bar heights \(5, 0, 10, 15\) in the order pencils, erasers, rulers, markers. 2. Graph a) has those values and keeps the erasers category with no visible bar above zero. 3. Graph b) incorrectly gives erasers a height of \(5\). 4. Graph c) incorrectly gives rulers a height of \(5\).

Answer

Graph a) is correct.
5381413
Which two animal teams differ by exactly \(8\) collected items? Name every pair that works.
Figure for problem 538141

Hints

- Write down the four values. - Find the difference for each possible pair in an organized way. - Make sure you list every pair with a difference of \(8\).

Solution

1. Hedgehog and Mouse differ by \(20 - 12 = 8\). 2. Frog and Owl differ by \(16 - 8 = 8\). 3. Checking the other pairs shows that none of their differences is \(8\).

Answer

Hedgehog and Mouse; Frog and Owl.
5381513
Which two groups have the closest scores? What is the difference between their scores?
Figure for problem 538151

Hints

- Write down all four scores. - Compare the differences between possible pairs. - Choose the least positive difference.

Solution

1. Compare the score differences for all pairs. 2. The least difference is between Group B with \(30\) points and Group C with \(25\) points. 3. Their difference is \(30 - 25 = 5\) points.

Answer

Groups B and C have the closest scores. Their scores differ by \(5\) points.
5381603
Divide the four groups into two pairs so that the pairs have equal point totals. Give the pairing.
Figure for problem 538160

Hints

- Write down the four point values. - Test ways to split the groups into two pairs. - Add both pair totals to check that they are equal.

Solution

1. Groups A and B have \(10 + 25 = 35\) points. 2. Groups C and D have \(15 + 20 = 35\) points. 3. The two pair totals are equal.

Answer

Pair A with B and pair C with D. Each pair has \(35\) points.
5381663
Only Group C may receive more points. What is the least number of points it needs to be alone in first place?
Figure for problem 538166

Hints

- Find the current greatest score. - Determine the least score that is greater than it. - Subtract Group C's current score from that target.

Solution

1. Group C has \(20\) points, and the current greatest score is \(25\). 2. To be alone in first place, Group C must have at least \(26\) points. 3. It needs \(26 - 20 = 6\) more points.

Answer

Group C needs at least \(6\) more points.
5381703
On which two days were exactly \(36\) admission tickets sold altogether? Name every possible pair.
Figure for problem 538170

Hints

- Write down all five day values. - Test pairs in an organized way. - List every pair with a sum of \(36\).

Solution

1. Monday and Friday give \(12 + 24 = 36\). 2. Tuesday and Thursday give \(15 + 21 = 36\). 3. Checking the other day pairs shows that none has a sum of \(36\).

Answer

Monday and Friday; Tuesday and Thursday.
5382293
A bar graph will show collections of \(60, 90, 150, 120\) bottle caps. Sam suggests using \(50\) bottle caps per grid interval. Which bars would end between gridlines? Then choose the **largest** interval from \(10, 20, 30, 50\) that places all four endpoints on gridlines.

Hints

- Check the \(50\)-cap scale one value at a time. - Test each candidate interval against all four bar values. - Choose the largest candidate that makes every endpoint land exactly on a gridline.

Solution

1. With intervals of \(50\), only \(150\) lands on a gridline. The bars at \(60, 90, 120\) end between gridlines. 2. Intervals of \(10\) work for all four values. 3. Intervals of \(20\) do not work for \(90\) or \(150\). 4. Intervals of \(30\) work for all four values, and \(50\) does not. 5. Therefore, \(30\) is the largest listed interval that works.

Answer

With intervals of \(50\), the bars at \(60, 90, 120\) end between gridlines. Use intervals of \(30\) to place all four endpoints on gridlines.
5383083
Two bar graphs should be about the same visual size. Data set A is \(4, 8, 12, 16\), and data set B is \(40, 80, 120, 160\). Should both graphs use “one grid interval equals \(4\)”? Decide and suggest an appropriate interval size for each graph.

Hints

- Compare the scale size with the largest value in each data set. - Check that each graph is accurate without using an unnecessary number of gridlines.

Solution

1. Intervals of \(4\) work well for data set A because the scale reaches \(16\) in only \(4\) intervals. 2. For data set B, intervals of \(4\) would require \(160 \div 4 = 40\) intervals, making the graph crowded. 3. Intervals of \(40\) work well for data set B because the scale then reaches \(160\) in \(4\) intervals.

Answer

No. Use intervals of \(4\) for data set A and, for example, intervals of \(40\) for data set B.
5383093
A graph will show the values \(17, 21, 27, 33\). The possible interval sizes are \(2\), \(3\), and \(6\). Which interval size places the most bar endpoints exactly on gridlines? Also name any value that still falls between gridlines.

Hints

- Test each data value against each possible interval size. - Count how many values are exact multiples of each interval size.

Solution

1. With intervals of \(2\), none of the four odd values lies on a gridline. 2. With intervals of \(3\), the values \(21, 27, 33\) lie on gridlines, while \(17\) does not. 3. With intervals of \(6\), none of the four values is a multiple of \(6\). 4. Therefore, intervals of \(3\) place the most endpoints on gridlines.

Answer

Use intervals of \(3\). The values \(21, 27, 33\) lie on gridlines, and \(17\) lies between gridlines.

All problems may be used, copied and printed free of charge for school and tutoring, including paid tutoring. Commercial adaptations as well as publication or redistribution on the internet are not permitted.

