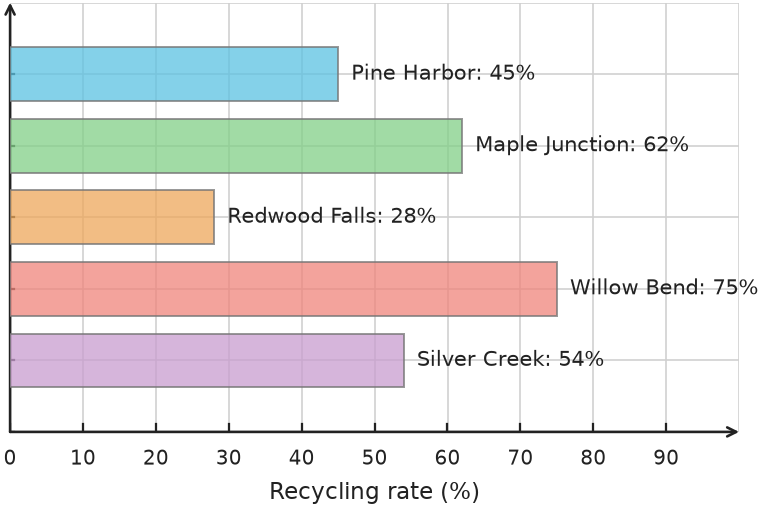
A study measured the recycling rates of five cities. The bar graph shows the percent of each city’s total waste that is recycled.
Use the graph to answer each question.
a) Pine Harbor produces \(800\,\text{t}\) of waste. How much is recycled?
b) Maple Junction produces \(1500\,\text{t}\) of waste. How much is recycled?
c) Redwood Falls produces \(250\,\text{t}\) of waste. How much is recycled?
d) Willow Bend produces \(400\,\text{t}\) of waste. How much is recycled?
e) Silver Creek produces \(2000\,\text{t}\) of waste. How much is not recycled?
Hints
- Read each city’s recycling rate from the graph.
- Multiply each city’s total waste by its recycling rate written as a decimal.
- For part e), pay attention to whether the question asks for the recycled or unrecycled amount.
- You can find the unrecycled percent by subtracting the recycling rate from \(100\%\).
Solution
1. Read the recycling rates from the graph: Pine Harbor, \(45\%\); Maple Junction, \(62\%\); Redwood Falls, \(28\%\); Willow Bend, \(75\%\); Silver Creek, \(54\%\).
2. For a), \(800\,\text{t} \times 0.45 = 360\,\text{t}\).
3. For b), \(1500\,\text{t} \times 0.62 = 930\,\text{t}\).
4. For c), \(250\,\text{t} \times 0.28 = 70\,\text{t}\).
5. For d), \(400\,\text{t} \times 0.75 = 300\,\text{t}\).
6. For Silver Creek, the percent not recycled is \(100\% - 54\% = 46\%\). Then \(2000\,\text{t} \times 0.46 = 920\,\text{t}\).
Answer
a) \(360\,\text{t}\)
b) \(930\,\text{t}\)
c) \(70\,\text{t}\)
d) \(300\,\text{t}\)
e) \(920\,\text{t}\)


