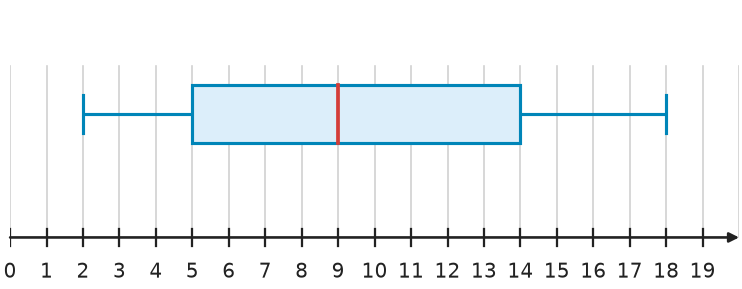
Which unordered data set matches the box plot?
(1) \(11, 9, 4, 13, 15, 9, 18, 6, 8, 2, 3, 16\)
(2) \(10, 12, 4, 15, 16, 12, 8, 13, 6, 3, 18, 2\)
(3) \(13, 16, 9, 6, 18, 4, 9, 2, 8, 15, 11, 8\)
Justify your choice by finding each data set's minimum, first quartile, median, third quartile, and maximum and comparing them with the box plot.
Hints
- Read the five-number summary from the box plot first.
- Order each data set before finding its median and quartiles.
- Check whether the minimum and maximum eliminate any choices.
- Compare the remaining quartiles and median one at a time.
Solution
1. The box plot shows the five-number summary \(2, 5, 9, 14, 18\).
2. Data set (1), in order, is \(2, 3, 4, 6, 8, 9, 9, 11, 13, 15, 16, 18\). Its minimum is \(2\), \(Q_1 = (4 + 6) \div 2 = 5\), median is \((9 + 9) \div 2 = 9\), \(Q_3 = (13 + 15) \div 2 = 14\), and maximum is \(18\). These values match the box plot.
3. Data set (2) has median \((10 + 12) \div 2 = 11\), so it does not match.
4. Data set (3) has \(Q_1 = (6 + 8) \div 2 = 7\), so it does not match.
5. Therefore, only data set (1) matches the box plot.
Answer
Data set (1) matches the box plot. Its five-number summary is \(2, 5, 9, 14, 18\).


