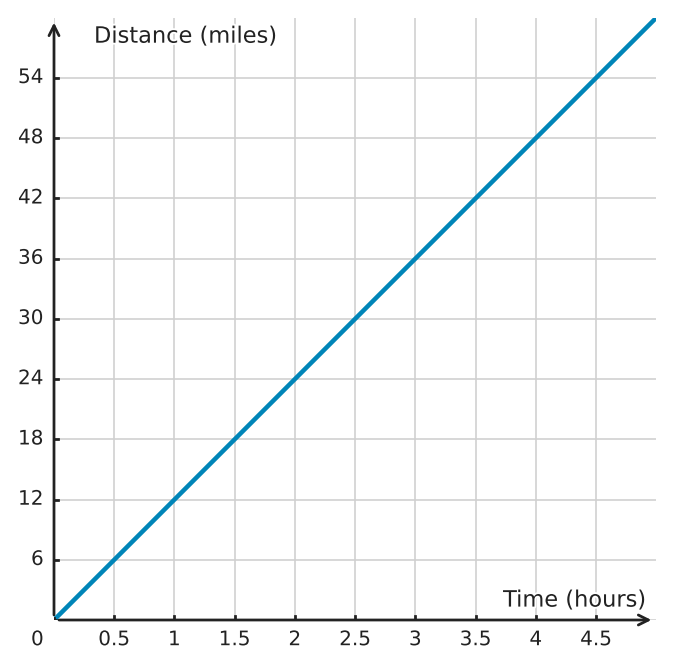
The graph shows Sofia's distance during the first \(5\) hours of a bicycle ride.
a) Use the graph to determine Sofia's constant speed in miles per hour. State a point from the graph that supports your answer.
b) Make a table for the relationship between time, in hours, and distance, in miles, for \(1\), \(2\), \(3\), \(4\), and \(5\) hours.
c) Why does it make sense in this situation for the graph to be a connected line instead of isolated points?
d) Use the graph to find the distance after \(150\) minutes, then verify the value using the speed from part a).
Hints
- Read a convenient point on the line and compare its distance coordinate with its time coordinate.
- Use the rate you found from the graph to build the whole-hour table.
- Think about whether Sofia also travels during parts of an hour.
- Convert \(150\) minutes to hours and locate that time directly on the graph before checking by calculation.
Solution
1. The graph contains points such as \((1,12)\) and \((2,24)\). The ratio of distance to time is \(12\), so Sofia's speed is \(12\,\text{mi/h}\).
2. Use the rate \(12\,\text{mi/h}\) to complete the table.
<table><tr><td>Time</td><td>\(1\,\text{h}\)</td><td>\(2\,\text{h}\)</td><td>\(3\,\text{h}\)</td><td>\(4\,\text{h}\)</td><td>\(5\,\text{h}\)</td></tr><tr><td>Distance</td><td>\(12\,\text{mi}\)</td><td>\(24\,\text{mi}\)</td><td>\(36\,\text{mi}\)</td><td>\(48\,\text{mi}\)</td><td>\(60\,\text{mi}\)</td></tr></table>
3. A connected line makes sense because time and distance vary continuously during the ride, including between whole-hour times.
4. Since \(150\) minutes is \(2.5\) hours, the graph gives \(30\) miles at \(t=2.5\). The calculation \(12\cdot2.5=30\) verifies the graph reading.
Answer
a) \(12\,\text{mi/h}\); for example, the graph contains \((1,12)\).
b)
<table><tr><td>Time</td><td>\(1\,\text{h}\)</td><td>\(2\,\text{h}\)</td><td>\(3\,\text{h}\)</td><td>\(4\,\text{h}\)</td><td>\(5\,\text{h}\)</td></tr><tr><td>Distance</td><td>\(12\,\text{mi}\)</td><td>\(24\,\text{mi}\)</td><td>\(36\,\text{mi}\)</td><td>\(48\,\text{mi}\)</td><td>\(60\,\text{mi}\)</td></tr></table>
c) A connected line makes sense because Sofia travels continuously between the listed times.
d) \(30\,\text{mi}\); the graph shows \((2.5,30)\), and \(12\cdot2.5=30\).


