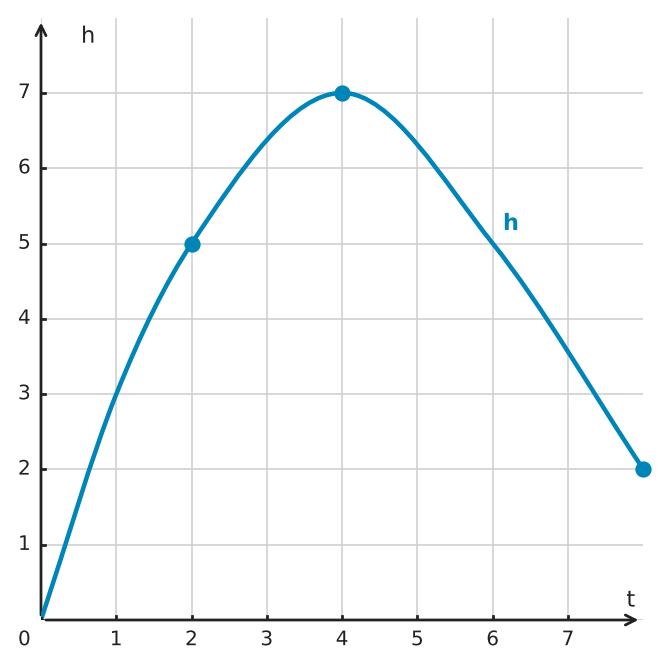
A drone's altitude \(h\), in meters, changes with time \(t\), in minutes, as shown by the curved graph.
a) Find the average rate of change of altitude from \(t=2\) to \(t=4\).
b) Find the average rate of change from \(t=4\) to \(t=8\) and interpret its sign in context.
c) For what time \(T>2\) is the average rate of change from \(t=2\) to \(t=T\) equal to \(0\)? Explain how the graph shows this.
Hints
- Read the endpoint altitudes from the marked points before calculating any rates.
- A negative average rate means the ending altitude is below the starting altitude.
- For an average rate of zero, ask what must be true about the two endpoint altitudes.
Solution
1. The graph gives \(h(2)=5\) and \(h(4)=7\). The average rate is \(\frac{7-5}{4-2}=1\,\text{m/min}\).
2. The graph gives \(h(8)=2\). From \(t=4\) to \(t=8\), the average rate is \(\frac{2-7}{8-4}=-\frac{5}{4}\,\text{m/min}\). The negative sign means the drone loses altitude overall during that interval.
3. An average rate of \(0\) from \(t=2\) to \(t=T\) requires \(h(T)=h(2)\). The graph returns to altitude \(5\,\text{m}\) at \(T=6\), so the average rate on \([2,6]\) is \(0\).
Answer
a) \(1\,\text{m/min}\)
b) \(-\frac{5}{4}\,\text{m/min}\); the drone loses altitude overall.
c) \(T=6\,\text{min}\). The graph shows \(h(6)=h(2)=5\), so the secant line from \(t=2\) to \(t=6\) is horizontal and has average rate \(0\).


