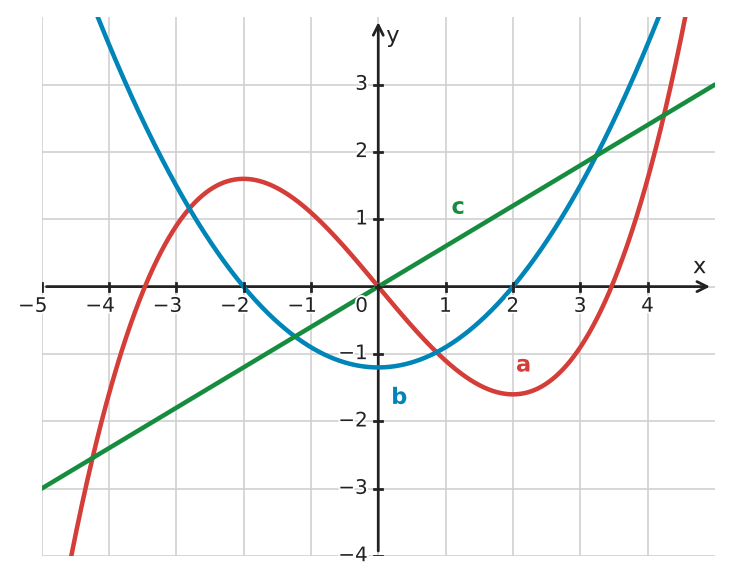
The figure shows three graphs, \(a\), \(b\), and \(c\). One graph represents a function, another represents its first derivative, and the third represents its second derivative.
Identify which graph is the original function, the first derivative, and the second derivative. Justify your assignment step by step using relationships such as local extrema and zeros.
Hints
- Match local extrema of one graph with zeros of another.
- Compare increasing and decreasing behavior with the sign of the derivative.
- After matching one derivative pair, check whether the remaining graph is the derivative of the middle graph.
Solution
1. Graph \(a\) has a local maximum at \(x = -2\) and a local minimum at \(x = 2\). Graph \(b\) is zero at those same values, is negative between them, and is positive outside them. Therefore, \(b\) is the derivative of \(a\).
2. Graph \(b\) has a local minimum at \(x = 0\). Graph \(c\) is zero at \(x = 0\), is negative for \(x < 0\), and is positive for \(x > 0\). Therefore, \(c\) is the derivative of \(b\).
3. Thus, \(a\) is the original function, \(b\) is its first derivative, and \(c\) is its second derivative.
Answer
Graph \(a\) is the original function, graph \(b\) is the first derivative, and graph \(c\) is the second derivative.


