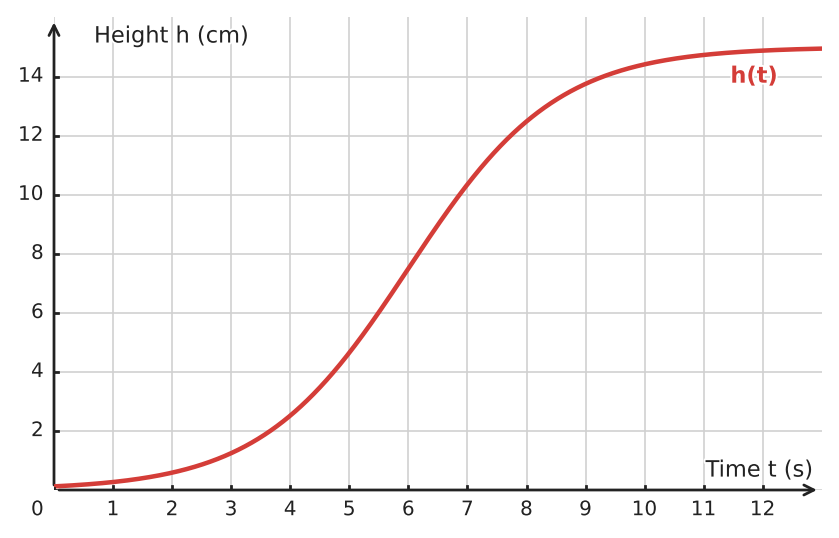
In an experiment, water flows into a specially shaped glass container at a constant rate of \(10\,\text{mL/s}\). The graph shows the water height \(h\), in centimeters, as a function of time \(t\), in seconds. For the numerical calculation in part c), the plotted curve is \(h(t)=\frac{15}{1+e^{-0.8(t-6)}}\).
a) Describe how the water level's rate of rise changes. When does the water level rise fastest?
b) Describe the container's general shape and justify it using the graph's changing steepness.
c) Find the water height after \(12\,\text{s}\) and the average rate of rise on \([0,12]\). Round both values to two decimal places.
Hints
- The slope of the height graph represents the rate at which the water level rises.
- With constant inflow, a steeper height graph corresponds to a smaller horizontal cross-sectional area.
- Use the supplied formula, not visual measurement, for the requested two-decimal numerical values.
- Average rate of rise is a secant slope over the stated interval.
Solution
1. The graph's slope increases until about \(t=6\,\text{s}\) and decreases afterward. Therefore, the water level rises fastest at about \(t=6\,\text{s}\).
2. With constant inflow, a larger rise rate corresponds to a smaller horizontal cross-sectional area. The container is relatively wide near the bottom, narrows toward the middle, and widens again near the top.
3. Using the supplied formula, \(h(0)=\frac{15}{1+e^{4.8}}\approx0.12\,\text{cm}\) and \(h(12)=\frac{15}{1+e^{-4.8}}\approx14.88\,\text{cm}\).
4. The average rate of rise is \(\frac{h(12)-h(0)}{12}\approx1.23\,\text{cm/s}\).
Answer
a) The water level rises fastest at about \(t=6\,\text{s}\); its rate of rise increases before then and decreases afterward.
b) The container is wide near the bottom, narrowest around the middle, and wider again near the top.
c) \(h(12)\approx14.88\,\text{cm}\); average rate of rise \(\approx1.23\,\text{cm/s}\)


